[GUI] Visualization of previous runs
Hi @wuruchi. Good to see that the visualization of previous runs has been deployed!
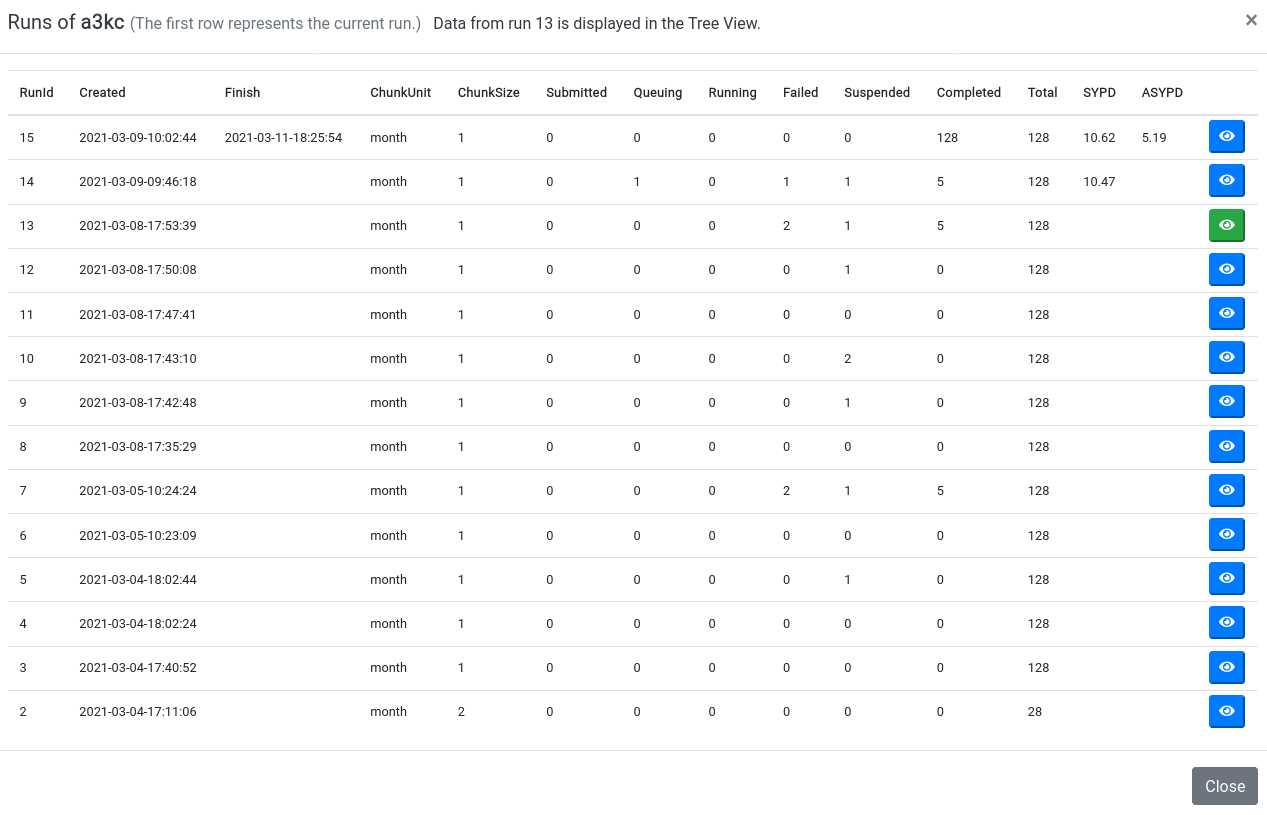
I have been doing some tests and it's possible that there is a bug in the job counts. If you see, the total count is always the same but I know that the experiment was extended at some point (see https://earth.bsc.es/gitlab/es/auto-ecearth3/-/issues/879#note_123652):
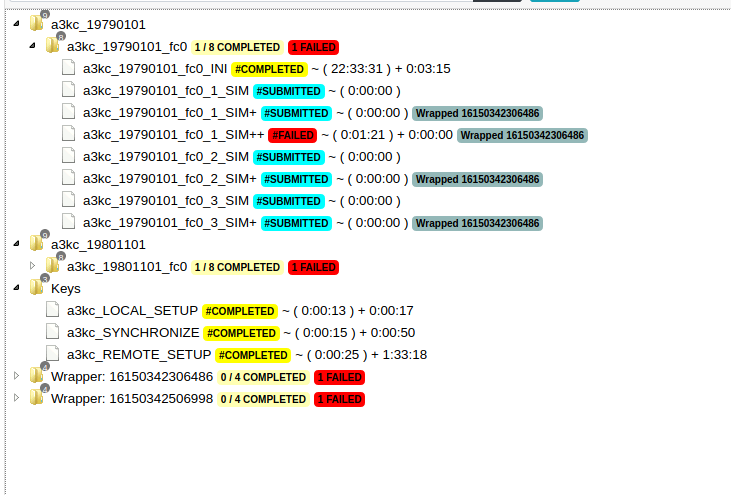
I have an additional question regarding the + ++ +++ marks: are those job retrials? But if so, how is that they appear as submitted and not FAILED?
Thank you!