• Map Dashboard
  • Glossary
  • Methodology
  • References
  • About the App
    • Team
    • Legal Notice
    • User Guide
    • Version

BSC team

Invalid username or password!

Loading...
Map configuration

Data download (based on map configuration)
to
Download files

  • Nitrogen Dioxide (NO₂)
  • Uncertainty
  • Probability of exceedance
  • Legislation and guidelines

Nitrogen Dioxide (NO₂) is a pollutant gas released in the air when fossil fuels are burned for transportation, heating, industry, energy production, etc. In cities, the main source of NO₂ is road traffic.

Furthermore, NO₂ reacts with other gasses to form other pollutants, such as ground-level ozone. The short and long-term exposition to NO₂ can cause or exacerbate health problems, which drives the need to analyze its levels. For example, NO₂ can cause irritation to airways and respiratory conditions or can be associated with cardiovascular issues.


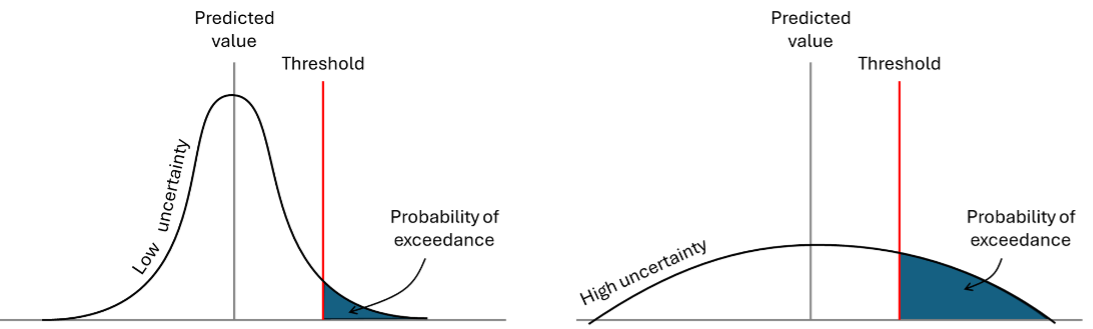
Uncertainty can be expressed as the statistical dispersion of a measurement or prediction, i.e., an interval above and below the real value.

The raw data from sensors, the air quality models and the interpolation method used to create the maps have limitations that are subject to various sources of error, i.e., uncertainties. Therefore, we cannot measure the exact value of an air pollutant concentration, or we cannot predict the NO₂ levels over the entire city without errors.


An exceedance is defined as the event in which a limit is outstripped. In the context of air quality, an exceedance occurs when the concentration of a pollutant exceeds the threshold value stipulated in the legislation or health recommendation.

The Probability of exceedance gives the likelihood of experiencing a hazardous concentration based on legislation or a recommendation. It is defined as the probability of occurrence of an event in which the concentration of a pollutant is higher than a specific limit. As it is a probability, can be expressed as a percentage, being 0% not likely to occur, and 100% very likely to occur. Calculating exceedance probability maps provides important risk information to governments, urban planners, social agents and communities.

Probability of exceedance concept (own source).

Directives 2008/50/EC and 2024/2881 of the European Parliament and of the Council on ambient air quality and cleaner air for Europe set air quality objectives designed to prevent or reduce the harmful effects of air pollution on human health and the environment. Directive 2024/2881, published in 2024, sets stricter limits on ambient air pollution than Directive 2008/50/EC.

Additionally, the World Health Organization (WHO) sets the 2021 Air Quality Guidelines. Although these are not legally binding limits, they provide evidence-based recommendations of limit values for air pollutants to protect human health.

The following table summarizes NO₂ concentration thresholds established by Directives 2008/50/EC and 2024/2881 and the WHO Air Quality Guidelines:

Summary of NO₂ concentration thresholds and guidelines (own source).

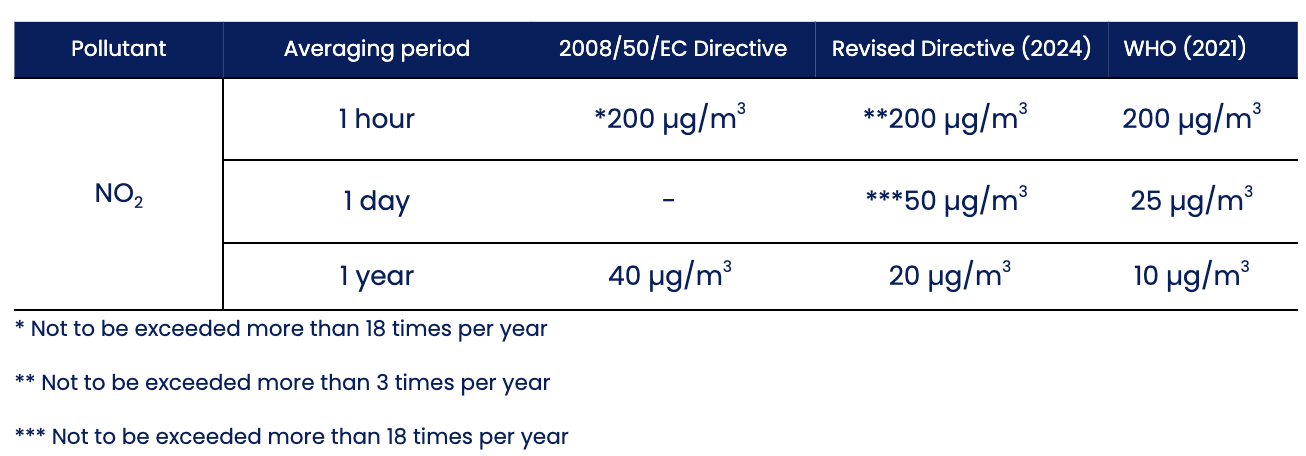
Regarding exceedance probability values, please note that this website allows users to visualize exceedance probability maps of the annual limit values set by Directives 2008/50/EC (40 µg/m³, in force at the time) and 2024/2881 (20 µg/m³), as well as the 2021 WHO guidelines (10 µg/m³), in the 'Map Dashboard: Map Configuration' section. Additionally, the 'Map Dashboard: Data Download' section enables users to download exceedance probability maps for those annual thresholds, as well as daily exceedance values based on the daily limits set by Directive 2024/2881 (50 µg/m³) and the 2021 WHO guidelines (25 µg/m³).

The model: CALIOPE-Urban

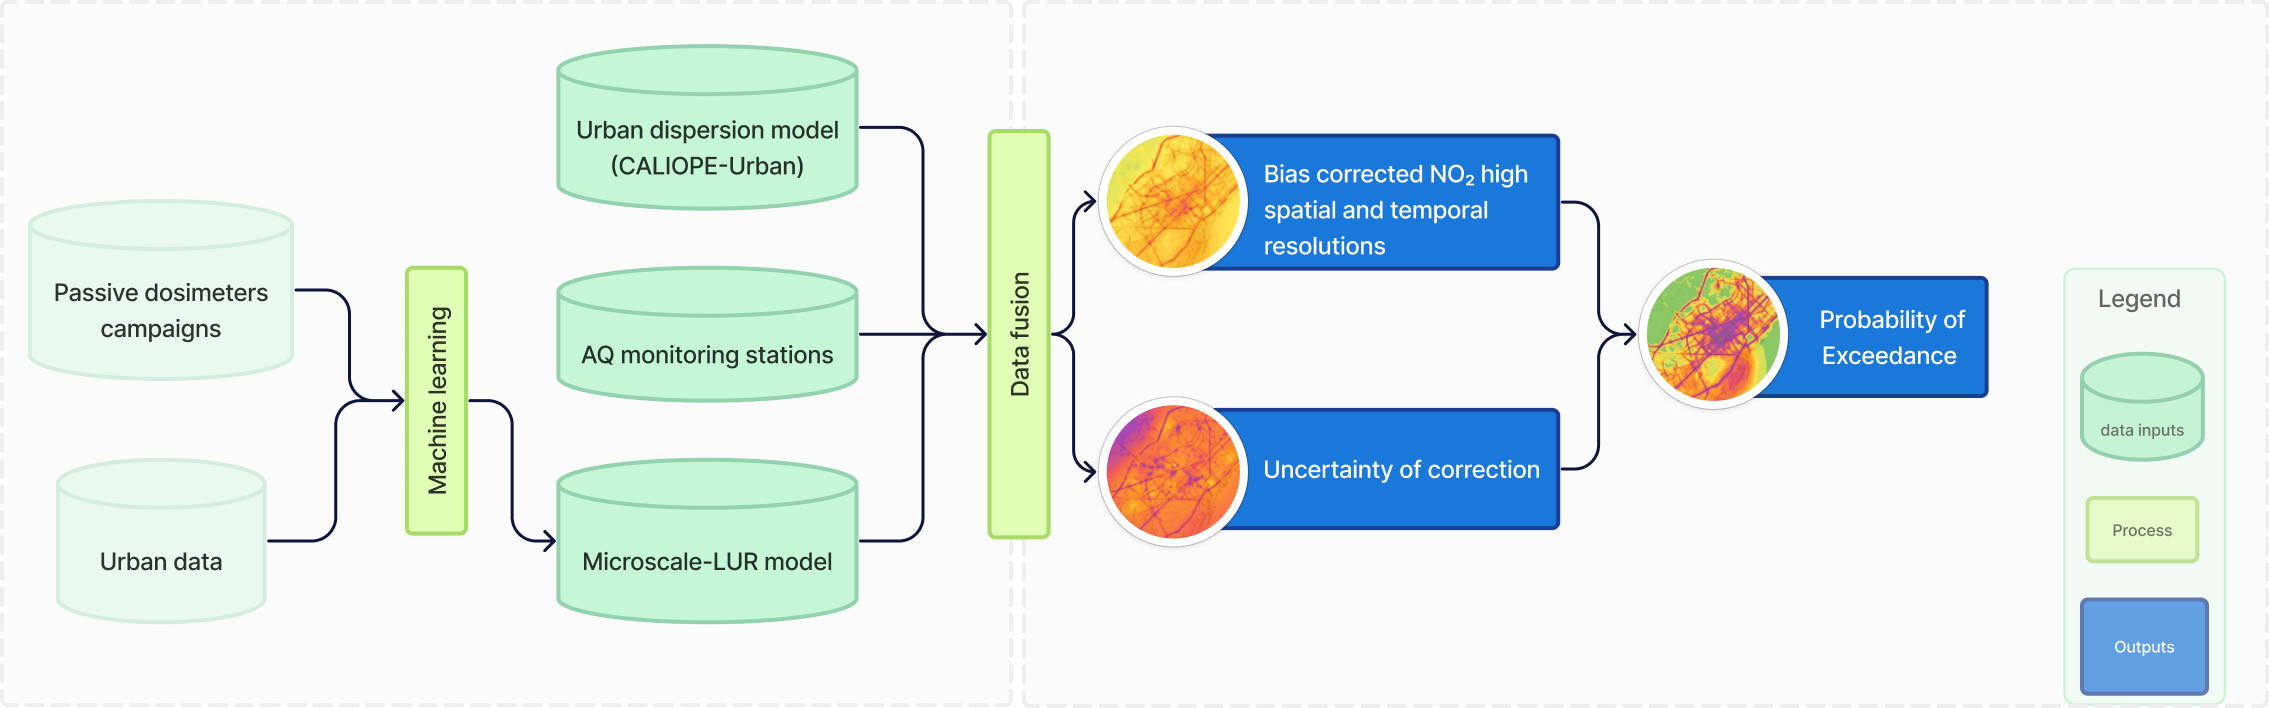
Hourly high-resolution concentrations of surface NO₂ at the street scale over the city of Barcelona are estimated using the CALIOPE-Urban multiscale air quality model (Benavides et al., 2019). At the regional scale, CALIOPE-Urban relies on the regional air quality modeling system CALIOPE (Baldasano Recio et al., 2011) for predicting the urban background NO₂ concentration.

Post-processing: data fusion

The data-fusion method combines (Criado et al., 2023):

  1. Near-real-time hourly observations obtained from the official air quality monitoring network,
  2. The output of an urban air quality model (CALIOPE-Urban) that operates at high spatial and temporal resolutions (up to 25m x 25m, hourly resolution),
  3. A microscale Land-Use-Regression (LUR) model based on machine-learning. The microscale-LUR model includes NO₂ experimental campaigns and various urban datasets, such as traffic flow or average building density. Calculation of uncertainty

Besides the bias corrected NO₂ hourly maps, the data-fusion method also computes the uncertainty associated to the variance of the estimated error during the correction process. By integrating corrected NO₂ values and their associated uncertainty, we are able to map over Barcelona the probability of exceeding any concentration limit, such as the hourly, daily, or annual thresholds set by the Air Quality Directive or the corresponding WHO guideline limits.

For more information about the methodology, such as the calculation of uncertainty or previous statistical results, please refer to Criado et al. (2023).

Methodology diagram (own source).

In case of using the contents of this website, kindly inform us via mail alvaro.criado@bsc.es

Please check the platform version with its respective release date (About the app : Version)

Map Dashboard
Map configuration

Variables (NO₂, Uncertainty, Probability of exceedance):

  • Criado, A., Carnerero, C., Frangeskou, A., Urquiza, D., Soret, A., Guevara, M., Jorba,O., and Armengol, J. M. (2026). Street-and census-level NO₂ data for Barcelona with uncertainty and exceedance probability mapping. Scientific Data. https://doi.org/10.1038/s41597-026-06592-x
  • Criado, A., Carnerero, C., Soret Miravet, A., Guevara, M., Jorba, O., and Mateu Armengol, J. Street- and census-level air quality (NO₂) data for Barcelona with uncertainty and exceedance probability mapping, version 1.0. Zenodo. 2025. https://doi.org/10.5281/zenodo.16737066

Layers:

  • AQ monitoring station, Bicycle lines, Schools, Hospitals, Nursing homes, Census tracts geometry, Barcelona municipality geometry: Ajuntament de Barcelona. (2019). Open Data BCN [Data set], under license Creative Commons by 4.0. https://opendata-ajuntament.barcelona.cat/es
  • Parks: OpenStreetMap contributors. (2023). Databases from OpenStreetMap [Data set]. OpenStreetMap Wiki. Distributed under the Open Data Commons Open Database License (ODbL). https://wiki.openstreetmap.org/wiki/Tag:leisure%3Dpark
Data download
  • Criado, A., Carnerero, C., Frangeskou, A., Urquiza, D., Soret, A., Guevara, M., Jorba,O., and Armengol, J. M. (2026). Street-and census-level NO₂ data for Barcelona with uncertainty and exceedance probability mapping. Scientific Data. https://doi.org/10.1038/s41597-026-06592-x
  • Criado, A., Carnerero, C., Soret Miravet, A., Guevara, M., Jorba, O., and Mateu Armengol, J. Street- and census-level air quality (NO₂) data for Barcelona with uncertainty and exceedance probability mapping, version 1.0. Zenodo. 2025. https://doi.org/10.5281/zenodo.16737066
Glossary
Legislation and Guidelines
  • Directive 2008/50/EC of the European Parliament and of the Council of 21 May 2008 on ambient air quality and cleaner air for Europe. http://data.europa.eu/eli/dir/2008/50/2015-09-18
  • Proposal for a revision of the Ambient Air Quality Directives. https://environment.ec.europa.eu/publications/revision-eu-ambient-air-quality-legislation_en
  • WHO global air quality guidelines. World Health Organization (2021). https://iris.who.int/handle/10665/345329
Methodology
The model: CALIOPE-Urban
  • Baldasano, J. M., Pay, M. T., Jorba, O., Gassó, S., & Jiménez-Guerrero, P. (2011). An annual assessment of air quality with the CALIOPE modeling system over Spain. Science of the Total Environment, 409(11), 2163-2178 https://doi.org/10.1016/j.scitotenv.2011.01.041
  • Benavides, J., Snyder, M., Guevara, M., Soret, A., Pérez García-Pando, C., Amato, F., Querol, X., & Jorba, O. (2019). CALIOPE-Urban v1. 0: coupling R-LINE with a mesoscale air quality modelling system for urban air quality forecasts over Barcelona city (Spain). Geoscientific Model Development, 12(7), 2811-2835 https://doi.org/10.5194/gmd-12-2811-2019
Post-processing: data fusion
  • Criado, A., Mateu Armengol, J., Petetin, H., Rodriguez-Rey, D., Benavides, J., Guevara, M., P��rez Garc��a-Pando, C., Soret, A., & Jorba, O. (2023). Data fusion uncertainty-enabled methods to map street-scale hourly NO₂ in Barcelona: a case study with CALIOPE-Urban v1. 0. Geoscientific Model Development, 16(8), 2193-2213 https://doi.org/10.5194/gmd-16-2193-2023
  • Criado, A., Mateu Armengol, J., Petetin, H., Rodriguez-Rey, D., Benavides, J., Guevara, M., Pérez García-Pando, C., Soret, A., & Jorba, O. (2022). Code and data set from data fusion uncertainty-enabled methods to map street-scale hourly NO₂ in Barcelona city: A case study with CALIOPE-Urban v1.0 (1.0). Zenodo. https://doi.org/10.5281/zenodo.7185913
Team
Contact

Álvaro Criado (alvaro.criado@bsc.es), Antonia Frangeskou (antonia.frangeskou@bsc.es)

Legal Notice

Firstly please check the References section

How should I use the information and products available in the uncertAIR platform?
  1. Data, images and other products from uncertAIR platform available on this server may be used solely for research and education purposes. Products may not be used for commercial purposes.
  2. In case of establishing links to the contents of this website, kindly inform us via mail alvaro.criado@bsc.es
  3. The uncertAIR partners cannot guarantee that the data are correct in all circumstances. Neither do accept any liability whatsoever for any error or omission in the data, or for any loss or damage arising from its use.
  4. Numerical data must not be supplied as a whole or in part to any third party without prior authorization.
  5. Articles, papers, or written scientific works of any form, that are based in whole or in part on data, images or other products supplied by uncertAIR, should contain an acknowledgement, giving credit to the Center every time data/images/products are used.
User Guide
Version history
  1. 01/09/2024: Version 1.0
  2. 05/11/2024: Version 1.1 : Improvements in all annual mean maps (new values) & daily-mean maps available for download for census tracts
  3. 04/02/2026: Version 1.2 : Fixed issue with probability of exceedance data for census tracts and daily mean (exc25 and exc50 were identical). Reference article updated.