The boundaries of color bars
Not a bug, but we found a confusing issue with color bars. In ColorBarContinuous(), there is a condition showing that the boundaries of color bar are "(, ]", i.e., the lower bound is not included and the upper bound is included.
  if (plot && !is.null(var_limits)) {
    if ((bar_limits[1] >= var_limits[1]) && !triangle_ends[1]) {
      warning("There are variable values smaller or equal to the lower limit ",
               "of the colour bar and the lower triangle end has been ",
               "disabled. These will be painted in the colour for NA values.")
    }
    if ((bar_limits[2] < var_limits[2]) && !triangle_ends[2]) {
      warning("There are variable values greater than the higher limit ",
               "of the colour bar and the higher triangle end has been ",
               "disabled. These will be painted in the colour for NA values.")
    }
  }
If you run the following script, you can get the first warning from "plot 1" and no warning from others.
set.seed(0)
data <- array(rep(0:10, each = 120),dim = c(lat = 30, lon = 44))
range(data)
# [1]  0 10

lons <- -10:33
lats <- 31:60
cols_white_red <- s2dv::clim.palette("bluered")(41)[21:41]

VizEquiMap(data, lon = lons, lat = lats, filled.continents = F,
           bar_limits = c(0, 10), toptitle = "plot 1",
           cols = cols_white_red, colNA = "grey", triangle_ends = c(F, F))

VizEquiMap(data, lon = lons, lat = lats, filled.continents = F,
           toptitle = "plot 2",
           cols = cols_white_red, colNA = "grey")

VizEquiMap(data, lon = lons, lat = lats, filled.continents = F,
           bar_limits = c(-0.00000001, 10), toptitle = "plot 3",
           cols = cols_white_red, colNA = "grey")

VizEquiMap(data, lon = lons, lat = lats, filled.continents = F,
           bar_limits = c(0, 10), toptitle = "plot 4",
           cols = cols_white_red, colNA = "grey", col_inf = "lightblue")
Warning message: In ColorBarContinuous(brks, cols, FALSE, subsampleg, bar_limits, : There are variable values smaller or equal to the lower limit of the colour bar and the lower triangle end has been disabled. These will be painted in the colour for NA values.
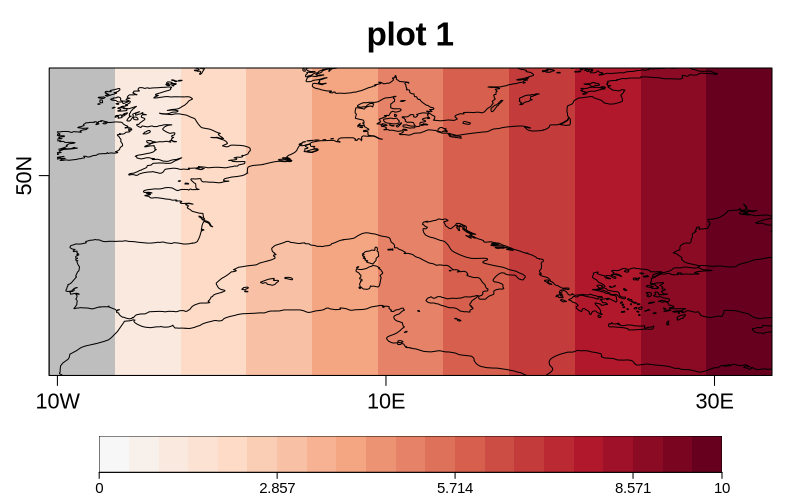
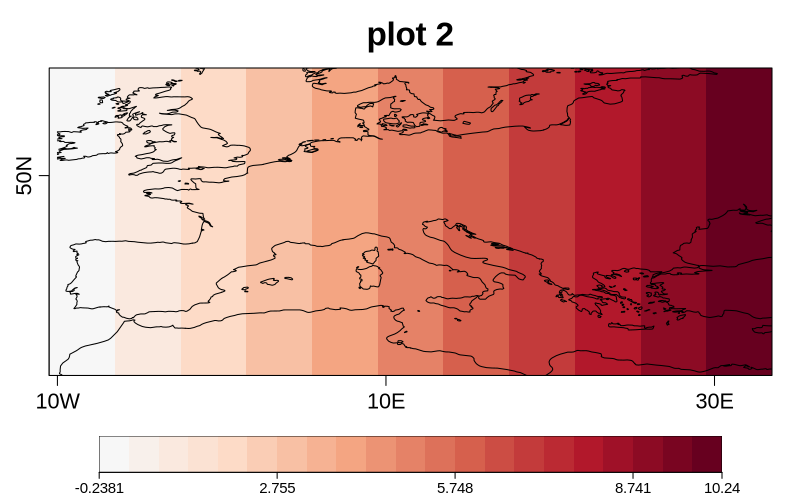
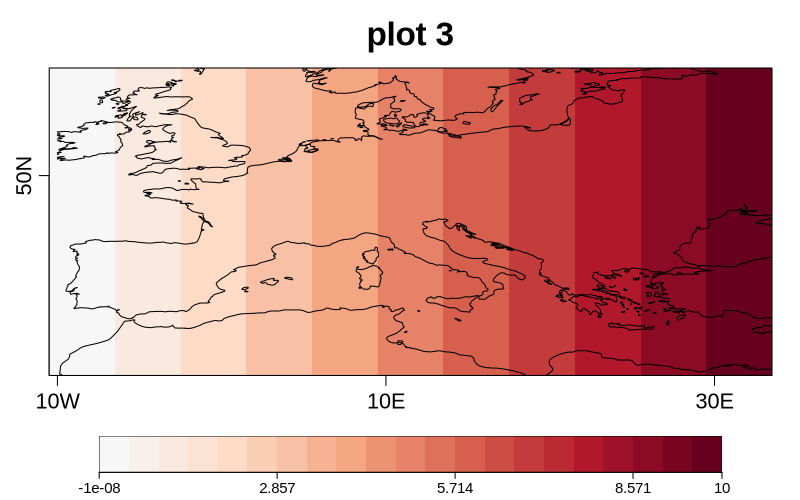
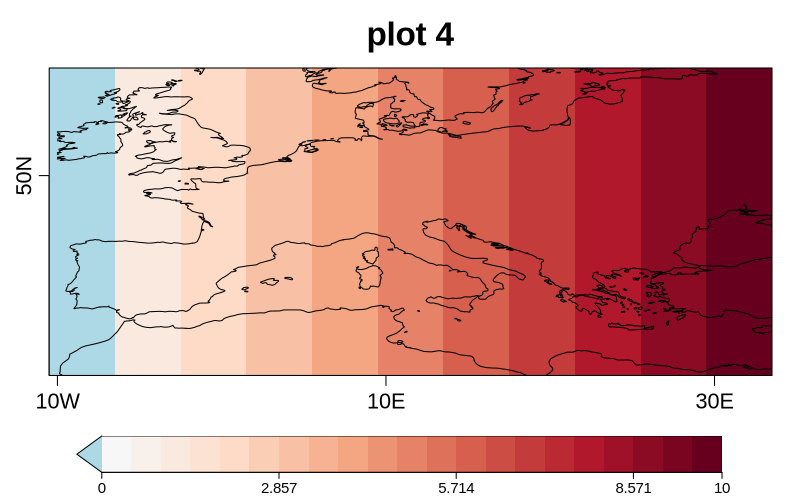
The plots are all correct and the warning explains why you get grey at value = 0 in plot 1. But two thoughts about this:
- It was confusing to me at the first glimpse at the plots because the lowest value should be 0, but the plots seem to me that there are below 0 values.
- The documentation of ColorBarContinuous() doesn't mention the "(, ]" definition. In fact, it is the behavior of R function image() if I'm not wrong, but it may be good to add this note in the function.
Maybe we can improve the function by adding one parameter to specify if the value right at the lower boundary should go to the lower triangle or be included in the lowest interval. But if it is too complicated or too much tuning, no action is needed.
Best,
An-Chi