Skip to content
GitLab
Projects Groups Topics Snippets
  • /
  • Help
    • Help
    • Support
    • Community forum
    • Submit feedback
  • Sign in
  • E esviz
  • Project information
    • Project information
    • Activity
    • Labels
    • Members
  • Repository
    • Repository
    • Files
    • Commits
    • Branches
    • Tags
    • Contributor statistics
    • Graph
    • Compare revisions
  • Issues 15
    • Issues 15
    • List
    • Boards
    • Service Desk
    • Milestones
  • Merge requests 4
    • Merge requests 4
  • CI/CD
    • CI/CD
    • Pipelines
    • Jobs
    • Schedules
  • Deployments
    • Deployments
    • Environments
    • Releases
  • Packages and registries
    • Packages and registries
    • Package Registry
    • Terraform modules
  • Monitor
    • Monitor
    • Incidents
  • Analytics
    • Analytics
    • Value stream
    • CI/CD
    • Repository
  • Wiki
    • Wiki
  • Snippets
    • Snippets
  • Activity
  • Graph
  • Create a new issue
  • Jobs
  • Commits
  • Issue Boards
Collapse sidebar
  • Earth SciencesEarth Sciences
  • esviz
  • Issues
  • #23
Closed
Open
Issue created Mar 11, 2025 by Nadia Milders@nmildersDeveloper

Issue with PlotEquiMap filled.oceans

Hi @abatalla and @vagudets,

I am plotting maps with the function PlotEquiMap through SUNSET. The region which I am plotting is Ethiopia (latmin: 2, latmax: 16, lonmin: 30, lonmax: 50) and I am requesting filled.oceans = TRUE. The resulting plot looks like this, filling in ocean on the left side of the plot where there should none.

image

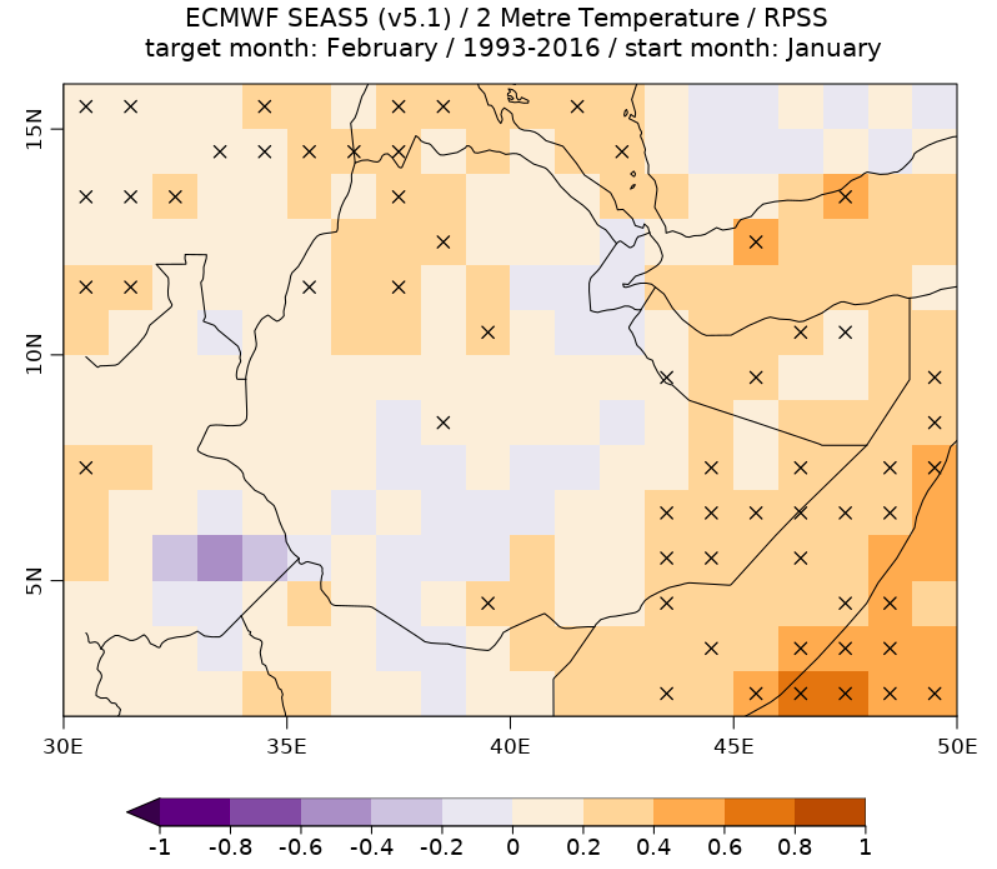
Without the filled oceans, the plot looks like this, with the country borders not reaching the left side of the plot.

image

Is there any way to overcome this issue?

Thanks,

Nadia

Assignee
Assign to
Time tracking