This MR adds two parameters to VizMostLikelyQuantileMap() (margin_scale and bar_extra_margin), that were previously accessible through ... and defined in VizCombinedMap(). These parameters control the plot margins and the spacing around the color bar, addressing a longstanding issue of the color bar appearing too thin by default when the grid cells were square. Making them explicit in VizMostLikelyQuantileMap() avoids requiring users to read the documentation of an internal function.
-
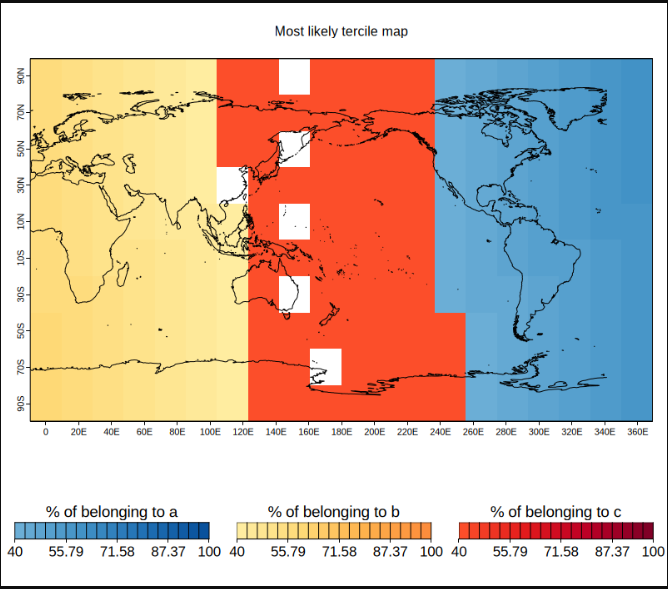
margin_scale: plot margins
#'@param margin_scale Numeric vector of length 4 specifying the plot margins
#'  (excluding the color bar), in the order: bottom, left, top, and right. If
#'  not specified (NULL), the default margins from \code{par("mar")}, which are
#'  c(5.1, 4.1, 4.1, 2.1), are used. Default is NULL.
-
bar_extra_margin: color bar margins
#'@param bar_extra_margin Numeric vector of length 4 specifying the margins to
#'  be added around the color bar, in the order: bottom, left, top, and right.
#'  The units are margin lines. The default values are c(1.5, 0, 1.5, 0).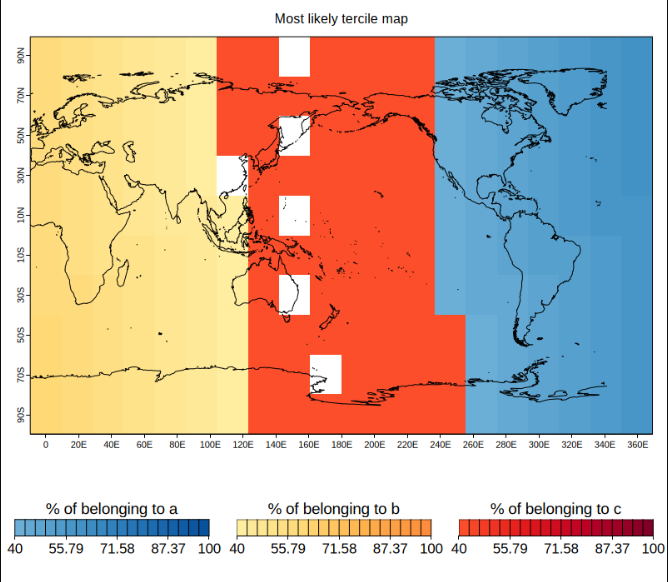
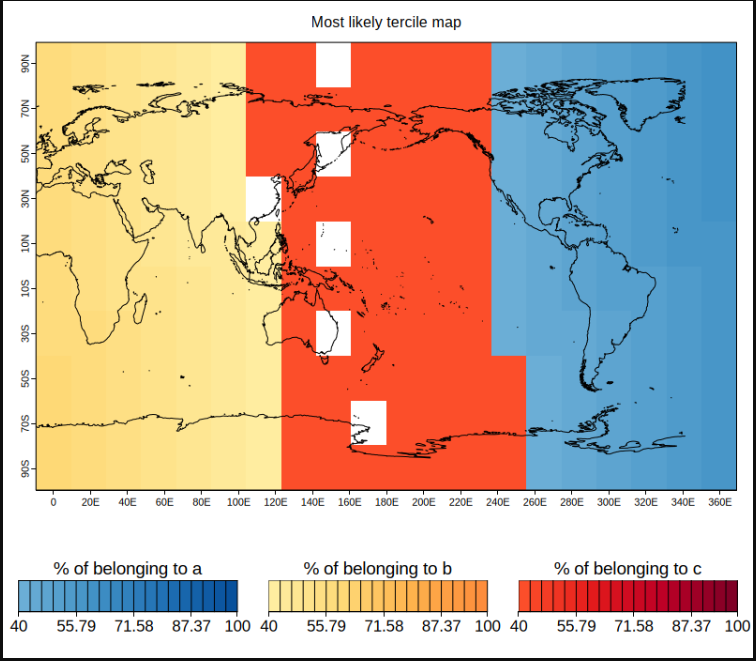
I have set the default of bar_extra_margin to c(1.5, 0, 1.5, 0) instead of c(2, 0, 2, 0) (default in VizCombinedMap), to make the color bar slightly thicker by default.
Let me know any thoughts you have on this.
Thank you,
Ariadna