Skip to content
GitLab
Projects Groups Topics Snippets
  • /
  • Help
    • Help
    • Support
    • Community forum
    • Submit feedback
  • Sign in
  • mapgenerator mapgenerator
  • Project information
    • Project information
    • Activity
    • Labels
    • Members
  • Repository
    • Repository
    • Files
    • Commits
    • Branches
    • Tags
    • Contributor statistics
    • Graph
    • Compare revisions
  • Issues 30
    • Issues 30
    • List
    • Boards
    • Service Desk
    • Milestones
  • Merge requests 0
    • Merge requests 0
  • CI/CD
    • CI/CD
    • Pipelines
    • Jobs
    • Schedules
  • Deployments
    • Deployments
    • Environments
    • Releases
  • Monitor
    • Monitor
    • Incidents
  • Analytics
    • Analytics
    • Value stream
    • CI/CD
    • Repository
  • Wiki
    • Wiki
  • Snippets
    • Snippets
  • Activity
  • Graph
  • Create a new issue
  • Jobs
  • Commits
  • Issue Boards
Collapse sidebar
  • Earth SciencesEarth Sciences
  • mapgeneratormapgenerator
  • Issues
  • #56
Closed
Open
Issue created Dec 21, 2018 by mtpay@mtpayDeveloper

scatter error

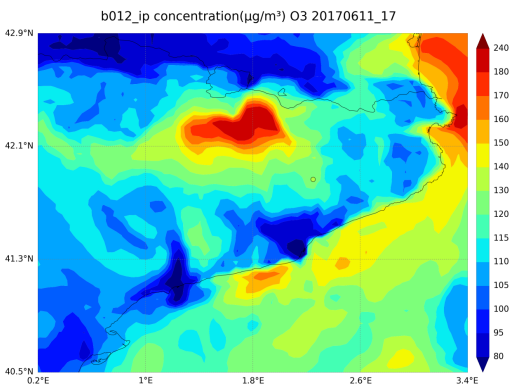
I have detected that the mapgenerator when plotting scatter plot the value of the dot does not correspond with the colour scale. In this example, the colour is 170.294156, but the colour used in the plot is between 130-140. See the following information.

INFO:mapgenerator.plotting.definitions:Dimension lev, operation or index/value: 0
INFO:mapgenerator.plotting.plotmap:Plotting scatter data:          lon        lat       color  size
17  2.248625  41.865225  170.294156    20 of keys Index([u'lon', u'lat', u'color', u'size'], dtype='object')
INFO:mapgenerator.plotting.plotmap:printing /esarchive/scratch/mtpay/output_captor/fig///map_b012_ip_O3_20170611_17
[1] "Maps done."

image

Assignee
Assign to
Time tracking