Skip to content
GitLab
Projects Groups Topics Snippets
  • /
  • Help
    • Help
    • Support
    • Community forum
    • Submit feedback
  • Sign in
  • mapgenerator mapgenerator
  • Project information
    • Project information
    • Activity
    • Labels
    • Members
  • Repository
    • Repository
    • Files
    • Commits
    • Branches
    • Tags
    • Contributor statistics
    • Graph
    • Compare revisions
  • Issues 30
    • Issues 30
    • List
    • Boards
    • Service Desk
    • Milestones
  • Merge requests 0
    • Merge requests 0
  • CI/CD
    • CI/CD
    • Pipelines
    • Jobs
    • Schedules
  • Deployments
    • Deployments
    • Environments
    • Releases
  • Monitor
    • Monitor
    • Incidents
  • Analytics
    • Analytics
    • Value stream
    • CI/CD
    • Repository
  • Wiki
    • Wiki
  • Snippets
    • Snippets
  • Activity
  • Graph
  • Create a new issue
  • Jobs
  • Commits
  • Issue Boards
Collapse sidebar
  • Earth SciencesEarth Sciences
  • mapgeneratormapgenerator
  • Issues
  • #77
Closed
Open
Issue created Jun 16, 2021 by jmateu@jmateuDeveloper

Colours problem in the NO2 map for Barcelona City

Hi @fbeninca ,

When plotting the NO2 data over the city of Barcelona using mapgenerator, in some cases, there are white and transparent regions, as shown in this Fig.image

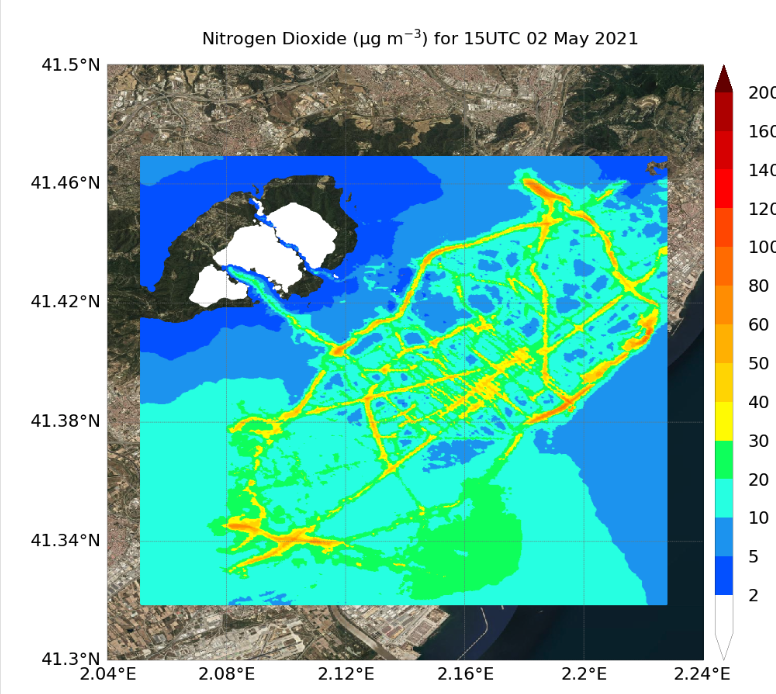
However, when opening the same data using ncview: imageimage

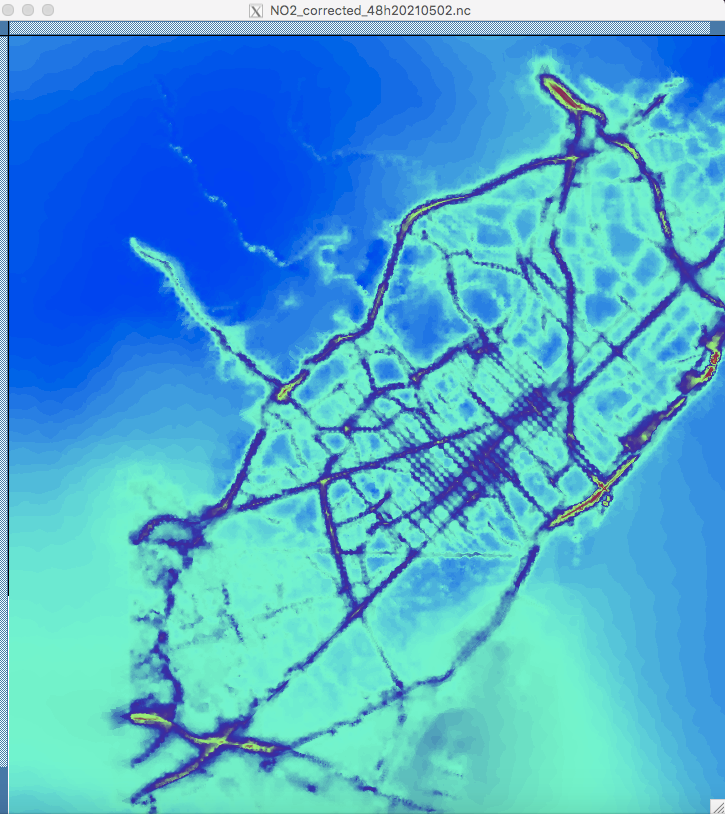
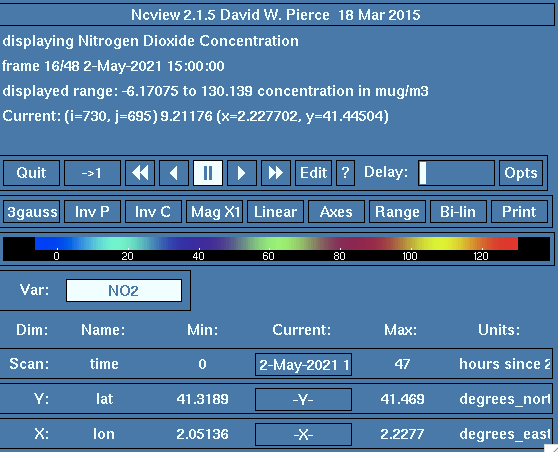
You can find the original data at /esarchive/scratch/jmateu/sim_rline_bcn/auto_CALIOPE_Urban/NO2_corrected_48h20210502.nc and the config file /esarchive/scratch/jmateu/sim_rline_bcn/auto_CALIOPE_Urban/urban.cfg

Thanks,

Jan

FYI: @molid

Assignee
Assign to
Time tracking