PlotEquiMap does not plot correctly the borders
Hi, I've found a problem in PlotEquiMap, the grid-points of the borders are not fully plotted. This is because the real extent of a plot is not given by the centers of the cells. Minimal reproducing example below:
tmp <- array(rnorm(12), dim=c(4,3))
PlotEquiMap(tmp, lon=c(0,1,2,3), lat=c(40,41,42), filled.continents=F, intxlon=1, intylat=1)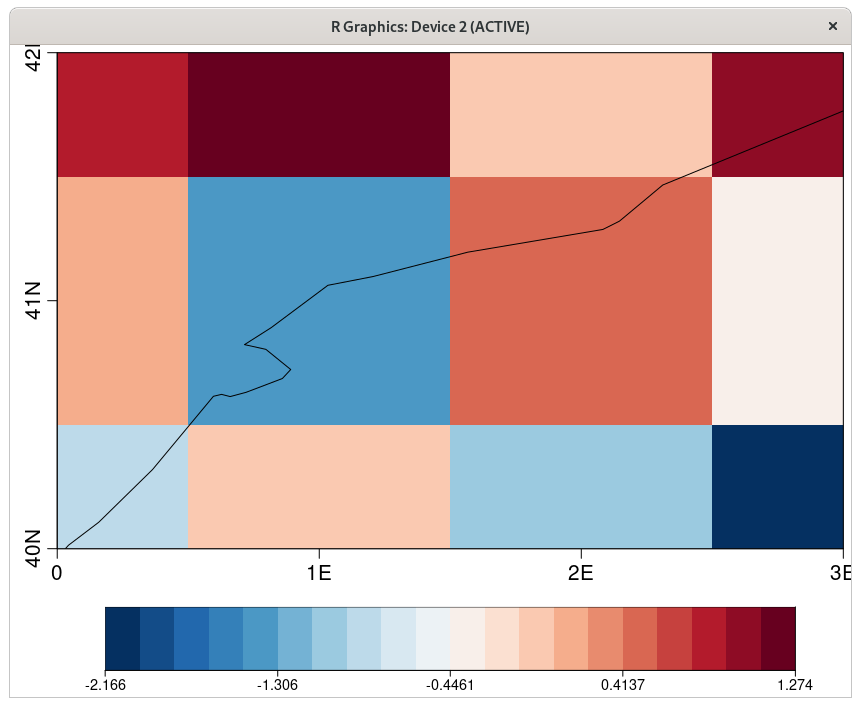
As you see, this plot should cover from -0.5 to 3.5 of longitude, and from 39.5 to 42.5 of latitude, and not 0-3 40-42.