PlotEquiMap: coastline is not complete when longitude is not continous
The issue is reported by @cchou. In the previous version 1.1.0, PlotEquiMap() could plot the coastline completely when the provided lon is not continuous, e.g., c(0:4, 350:359). But in the current version 1.2.0, it only plots part of the coastline (0:4).
data <- array(1:15, dim = c(lon = 15, lat = 9))
#lon <- -10:4
lon <- c(0:4, 350:359)
lat <- 36:44
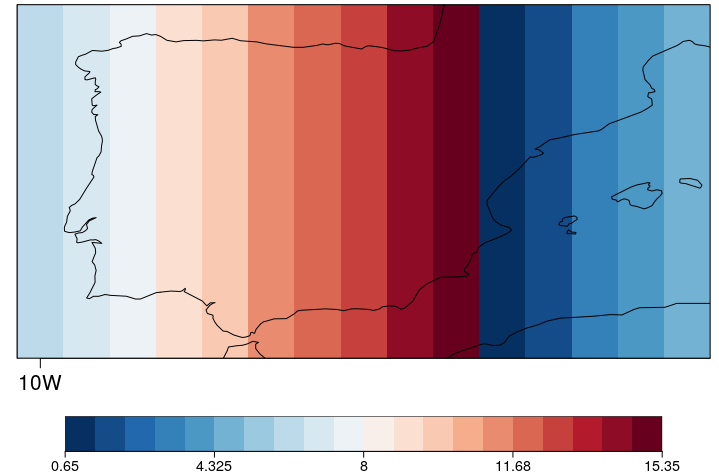
PlotEquiMap(data, lon, lat, filled.continents = F)[v1.1.0]
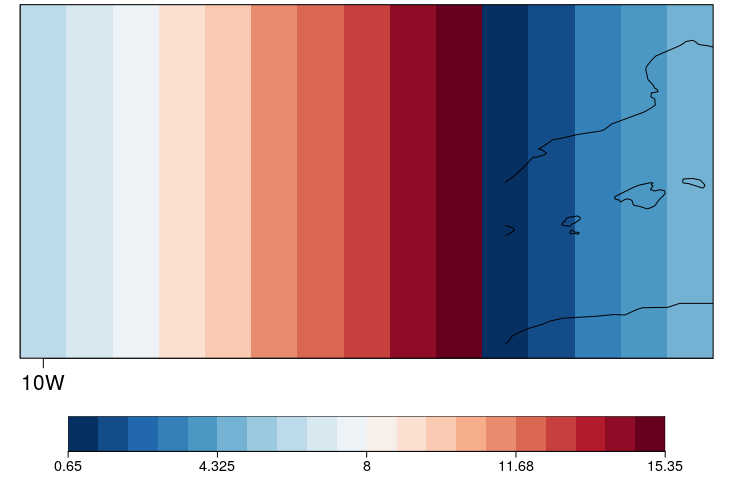
[v1.2.0]