PlotEquiMap erases part of the map
Hi @aho
I'm trying to create a plot of the Iberian Peninsula with data from ERA5-Land using PlotLayout() and PlotEquiMap() but there seems to be an issue with the continuity in longitude. I add @allabres because we've been working together on this.
Here is a reproducible example
### Load data
# I have been using a modified version of CST_Load() because it still depends on the s2dverification package

source("https://earth.bsc.es/gitlab/nperez/Flor/-/raw/master/CST_Load_devel_from_s2dv.R")
path_ERA5_CDS <- list(path='/esarchive/recon/ecmwf/era5land/$STORE_FREQ$_mean/$VAR_NAME$_f1h/$VAR_NAME$_$YEAR$$MONTH$.nc')

year_in <- 2019
year_fi <- 2020
month_in <- 1
month_fi <- 1

sdates <- paste0(year_in:year_fi, '0101')

dt.tas <- CST_Load_s2dv(var = 'tas',
                        exp = NULL, # We only require observed data
                        obs = list(path_ERA5_CDS),
                        sdates = sdates,
                        lonmax = 5, lonmin = 350,
                        latmax = 45, latmin = 35,
                        storefreq = 'monthly',
                        leadtimemin = month_in,
                        leadtimemax = month_fi,
                        output = "lonlat")

### Create plot
# I have been using a modified version of PlotEquiMap() because it still depends on the s2dverification package
source('https://earth.bsc.es/gitlab/es/s2dv/-/raw/master/R/PlotEquiMap.R')
.FilterUserGraphicArgs <- s2dv:::.FilterUserGraphicArgs
.KnownLonNames <- s2dv:::.KnownLonNames
.KnownLatNames <- s2dv:::.KnownLatNames
ColorBar <- s2dv::ColorBar
clim.palette <- s2dv::clim.palette
.IsColor<- s2dv:::.IsColor

PlotLayout(PlotEquiMap, c('lat', 'lon'),
           var=test$data[1,1,c(1,2),,],
           nrow=1, ncol=2,
           lon=dt.tas$lon,
           lat=dt.tas$lat,
           filled.continents=FALSE,
           titles=c(as.character(year_in), as.character(year_fi)),
           coast_width=2,
           filled.oceans=TRUE,
           country.borders=TRUE,
           intylat=1,
           intxlon=1)
This is the output
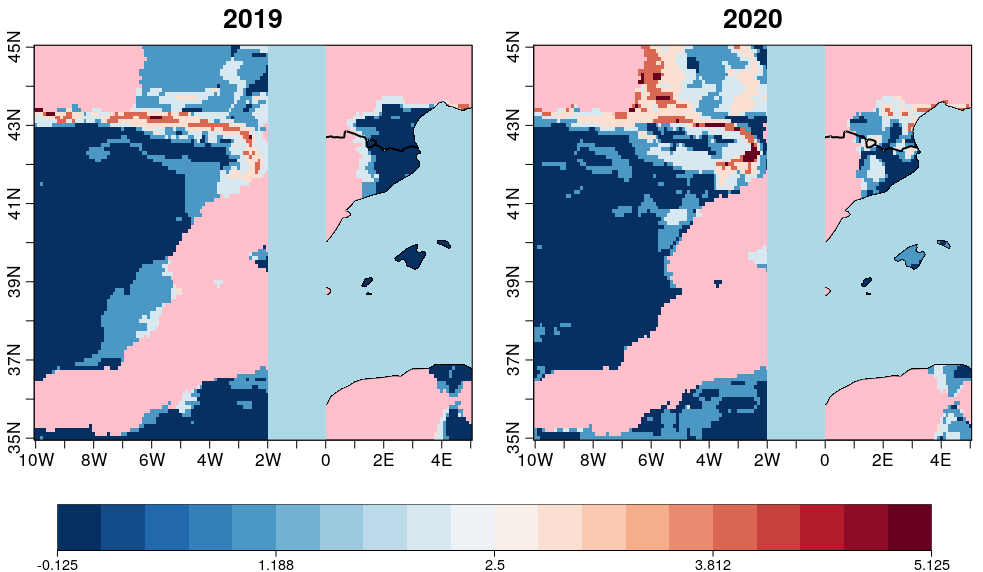
Thanks and best wishes!