Abs Bias SS significance seems wrong
Hi @aho
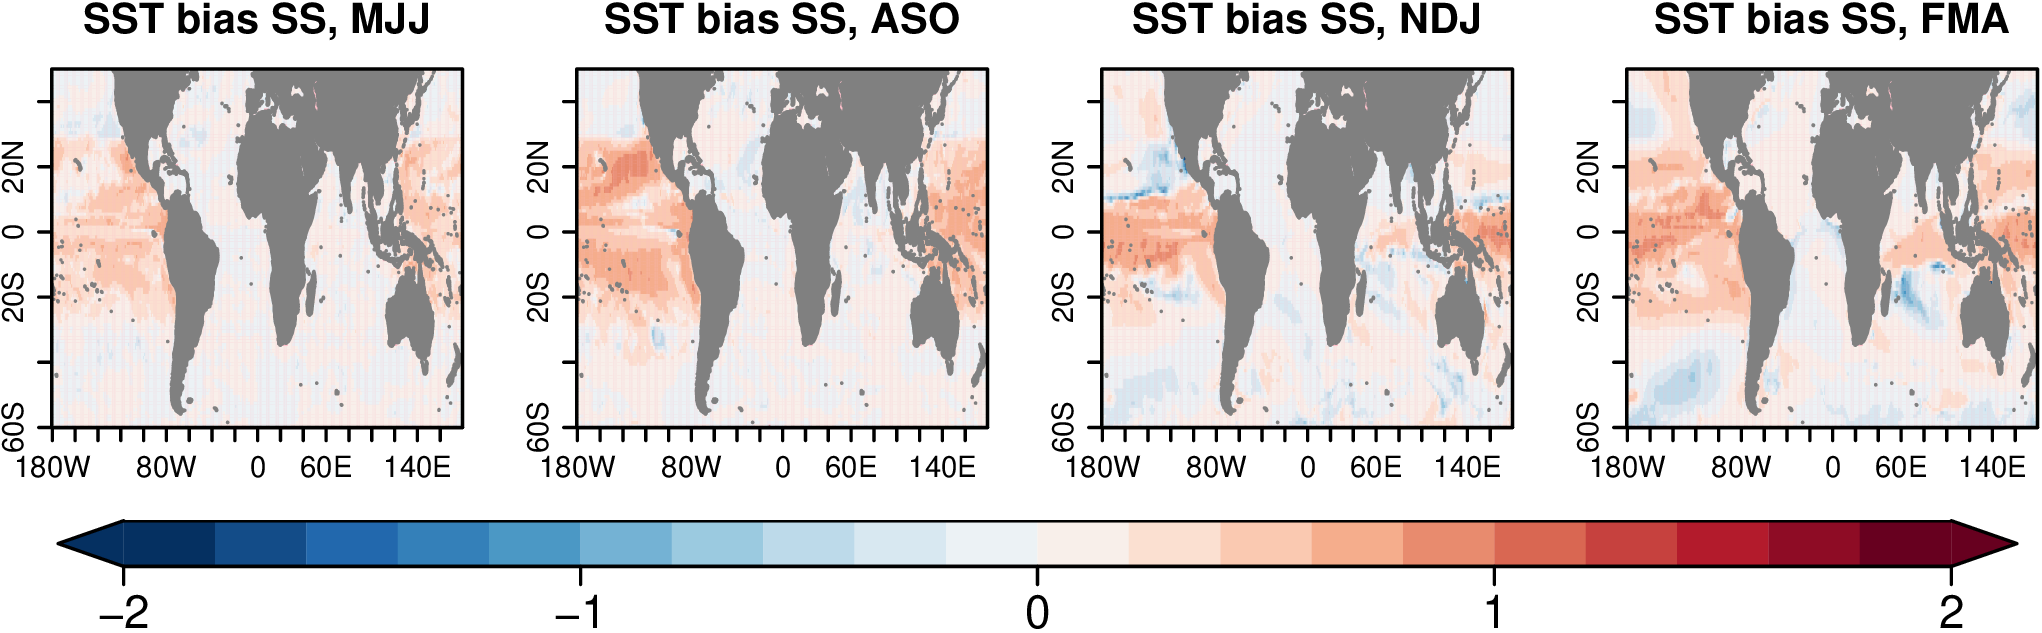
I used the function AbsBiasSS but it does not seem to capture the significance. I am adding here the results, and when I have time I will add the plot where I calculate the significance with a bootstrap test to see the difference.
# Delete previous data
rm(list=ls())
gc()

library(boot)
library(s2dv)
library(abind)
library(s2dverification)
library(startR)
library(ncdf4)
library(multiApply)
library(SpecsVerification)

#source('AbsBiasSS.R')
#source('Bias.R')
#source('RandomWalkTest.R')

# ATL
lonmin <- -180
lonmax <-  180
latmin <- -60
latmax <-  50

sdates <-  paste0(c(1981:2002), '0501')

# exp
repos_a511 <-  paste0('/esarchive/scratch/eexarcho/Eleftheria/Pace_maker/Data/a511/tos/r360x180/',
                      '$var$_Omon_EC-Earth3-CC_troppac-pacemaker_s$sdate$-$member$_r360x180_$chunk$.nc')

repos_a53d <-  paste0('/esarchive/scratch/eexarcho/Eleftheria/Pace_maker/Data/a53d/tos/r360x180/',
                      '$var$_Omon_EC-Earth3-CC_troppac-pacemaker_s$sdate$-$member$_r360x180_$chunk$.nc')

a511 <- Start(dat = repos_a511,
             var = 'tos',
             member = 'all',
             sdate = sdates,
             chunk = 'all',
          #   time = 'all',
             time = indices(1:12),  #first time step per day
             chunk_depends = 'sdate',
             time_across = 'chunk',
             merge_across_dims = TRUE,
             lat = values(list(latmin, latmax)),
             lat_reorder = Sort(), ##1
             lon = values(list(lonmin, lonmax)),
             lon_reorder = CircularSort(-180, 180), ##2
             synonims = list(lat = c('lat', 'latitude'),
                             lon = c('lon', 'longitude')),
             return_vars = list(lon = 'dat',  ##3
                                lat = 'dat',  ##3
                                time = 'sdate'),
             retrieve = T)


a53d <- Start(dat = repos_a53d,
             var = 'tos',
             member = 'all',
             sdate = sdates,
             chunk = 'all',
          #   time = 'all',
             time = indices(1:12),  #first time step per day
             chunk_depends = 'sdate',
             time_across = 'chunk',
             merge_across_dims = TRUE,
             lat = values(list(latmin, latmax)),
             lat_reorder = Sort(), ##1
             lon = values(list(lonmin, lonmax)),
             lon_reorder = CircularSort(-180, 180), ##2
             synonims = list(lat = c('lat', 'latitude'),
                             lon = c('lon', 'longitude')),
             return_vars = list(lon = 'dat',  ##3
                                lat = 'dat',  ##3
                                time = 'sdate'),
             retrieve = T)

###lons <- attr(exp, 'Variables')$common$tos$dim[[1]]$vals
###lats <- attr(exp, 'Variables')$common$tos$dim[[2]]$vals
lons <- as.vector(attr(a511, 'Variables')$dat1$lon)
lats <- as.vector(attr(a511, 'Variables')$dat1$lat)
dates <- attr(a511, 'Variables')$common$time
dates_file <- sort(unique(gsub('-', '', sapply(as.character(dates), substr, 1, 7))))
##
## obs
repos_obs <- '/esarchive/obs/ukmo/hadisst_v1.1/monthly_mean/$var$/$var$_$date$.nc'

obs.data <- Start(dat = repos_obs,
             var = 'tos',
             date = dates_file,
            # time = 'all',
            # time_across = 'date',
            # merge_across_dims = TRUE,
            # merge_across_dims_narm = TRUE,
## -----------------------------------------------------------------------
             time = values(dates),  #dim: [sdate = 2, time = 12]
             #because time is assigned by 'values', set the tolerance to avoid too distinct match
             time_var = 'time',
#             time_tolerance = as.difftime(372, units = 'hours'),
             #time values are across all the files
             time_across = 'date',
             #combine time and file_date dims
             merge_across_dims = TRUE,
             #exclude the additional NAs generated by merge_across_dims
             merge_across_dims_narm = TRUE,
             #split time dim, because it is two-dimensional
             split_multiselected_dims = TRUE,
## -----------------------------------------------------------------------
             lat = values(lats),
             lon = values(lons),
        #---------transform to get identical lat and lon------------ ##4
             transform = CDORemapper,
             transform_extra_cells = 2,
             transform_params = list(grid = 'r360x180',
                                     method = 'conservative',
                                     crop = c(lonmin, lonmax, latmin, latmax)),
             transform_vars = c('lat', 'lon'),
        #-----------------------------------------------------------
             synonims = list(lat = c('lat', 'latitude'),
                             lon = c('lon', 'longitude')),
             return_vars = list(lat = NULL,  ##3
                                lon = NULL,  ##3
                                time = 'date'),
             retrieve = TRUE)


abs.bias.a511.mjj <- s2dv::AbsBiasSS(a511.mjj, obs.mjj-273.15, a53d.mjj,
						   memb_dim = 'member', dat_dim='dat', ncores=16)
abs.bias.a511.aso <- s2dv::AbsBiasSS(a511.aso, obs.aso-273.15, a53d.aso,
						   memb_dim = 'member', dat_dim='dat', ncores=16)
abs.bias.a511.ndj <- s2dv::AbsBiasSS(a511.ndj, obs.ndj-273.15, a53d.ndj,
						   memb_dim = 'member', dat_dim='dat', ncores=16)
abs.bias.a511.fma <- s2dv::AbsBiasSS(a511.fma, obs.fma-273.15, a53d.fma,
						   memb_dim = 'member', dat_dim='dat', ncores=16)


min2=-2.
max2=2.
int2=(max2-min2)/20
interval2=seq(min2,max2,int2)
clim.palette(palette = "bluered")
color=clim.colors(20, palette = "bluered")
pdf( "../Figures/SST_bias_SS_a511_a53d.pdf" )
nf    <- layout(matrix(c(1, 2 , 3, 4, 5, 5, 5, 5),2,4,byrow=TRUE),
				widths=1, heights=c(1,0.3), TRUE)

s2dv::PlotEquiMap( abs.bias.a511.mjj$biasSS[1, 1, 1, 1, , ],
			 lons, lats ,
             toptitle= "SST bias SS, MJJ",
             cols=color, brks=interval2, drawleg = F,
             triangle_ends = c(T,T), col_inf = color[1], col_sup = color[20],
             filled.continents = T,
             dots = abs.bias.a511.mjj$sign[1, 1, 1, 1, ,],
             dot_size = 0.5,
             numbfig=4
			 )


s2dv::PlotEquiMap( abs.bias.a511.aso$biasSS[1, 1, 1, 1, , ],
			 lons, lats ,
             toptitle= "SST bias SS, ASO",
             cols=color, brks=interval2, drawleg = F,
             triangle_ends = c(T,T), col_inf = color[1], col_sup = color[20],
             filled.continents = T,
             dots = abs.bias.a511.aso$sign[1, 1, 1, 1, ,],
             dot_size = 0.5,
             numbfig=4
			 )

s2dv::PlotEquiMap( abs.bias.a511.ndj$biasSS[1, 1, 1, 1, , ],
			 lons, lats ,
             toptitle= "SST bias SS, NDJ",
             cols=color, brks=interval2, drawleg = F,
             triangle_ends = c(T,T), col_inf = color[1], col_sup = color[20],
             filled.continents = T,
             dots = abs.bias.a511.ndj$sign[1, 1, 1, 1, ,],
             dot_size = 0.5,
             numbfig=4
			 )

s2dv::PlotEquiMap( abs.bias.a511.fma$biasSS[1, 1, 1, 1, , ],
			 lons, lats ,
             toptitle= "SST bias SS, FMA",
             cols=color, brks=interval2, drawleg = F,
             triangle_ends = c(T,T), col_inf = color[1], col_sup = color[20],
             filled.continents = T,
             dots = abs.bias.a511.fma$sign[1, 1, 1, 1, ,],
             dot_size = 0.5,
             numbfig=4
			 )

ColorBar(brks=interval2,
         triangle_ends = c(T,T), col_inf = color[1], col_sup = color[20],
         cols = color, vert = FALSE)
dev.off()
#