timeseries plots missing legend and time axis has wrong labels
I found some issues with the visual appearance of the plots done by plot_timeseries.R in the auto-ecearth3 PLOT job
-
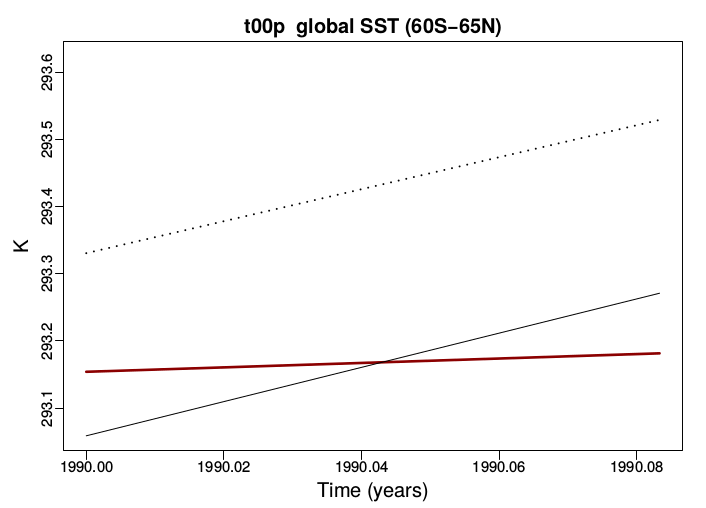
There is no legend so we can't know what are the black, dashed and red curves
-
The time axis is not very informative. For example, tick marks are at
1990.00 1990.05 1990.10 1990.15 1990.20 1990.25
or
1990.00 1990.02 1990.04 1990.06 1990.08
Attaching 2 plots which illustrate the problems