Add option to use PlotRobinson
Hi @vagudets
As previously discussed, I am opening this issue to add the option to display maps in the Robinson projection in addition to the current PlotEquiMap output.
For the PlotRobinson, I would include a parameter for the projection because for regional maps, the user may want to select a different projection.
Ideally, the plots could be saved in separate files, one for each forecast time. This plot should also include a caption. I have an example for the NAO case https://earth.bsc.es/gitlab/nperez/s2s-suite/-/blob/develop-moduleNAO/modules/Indices/R/compute_nao.R#L271
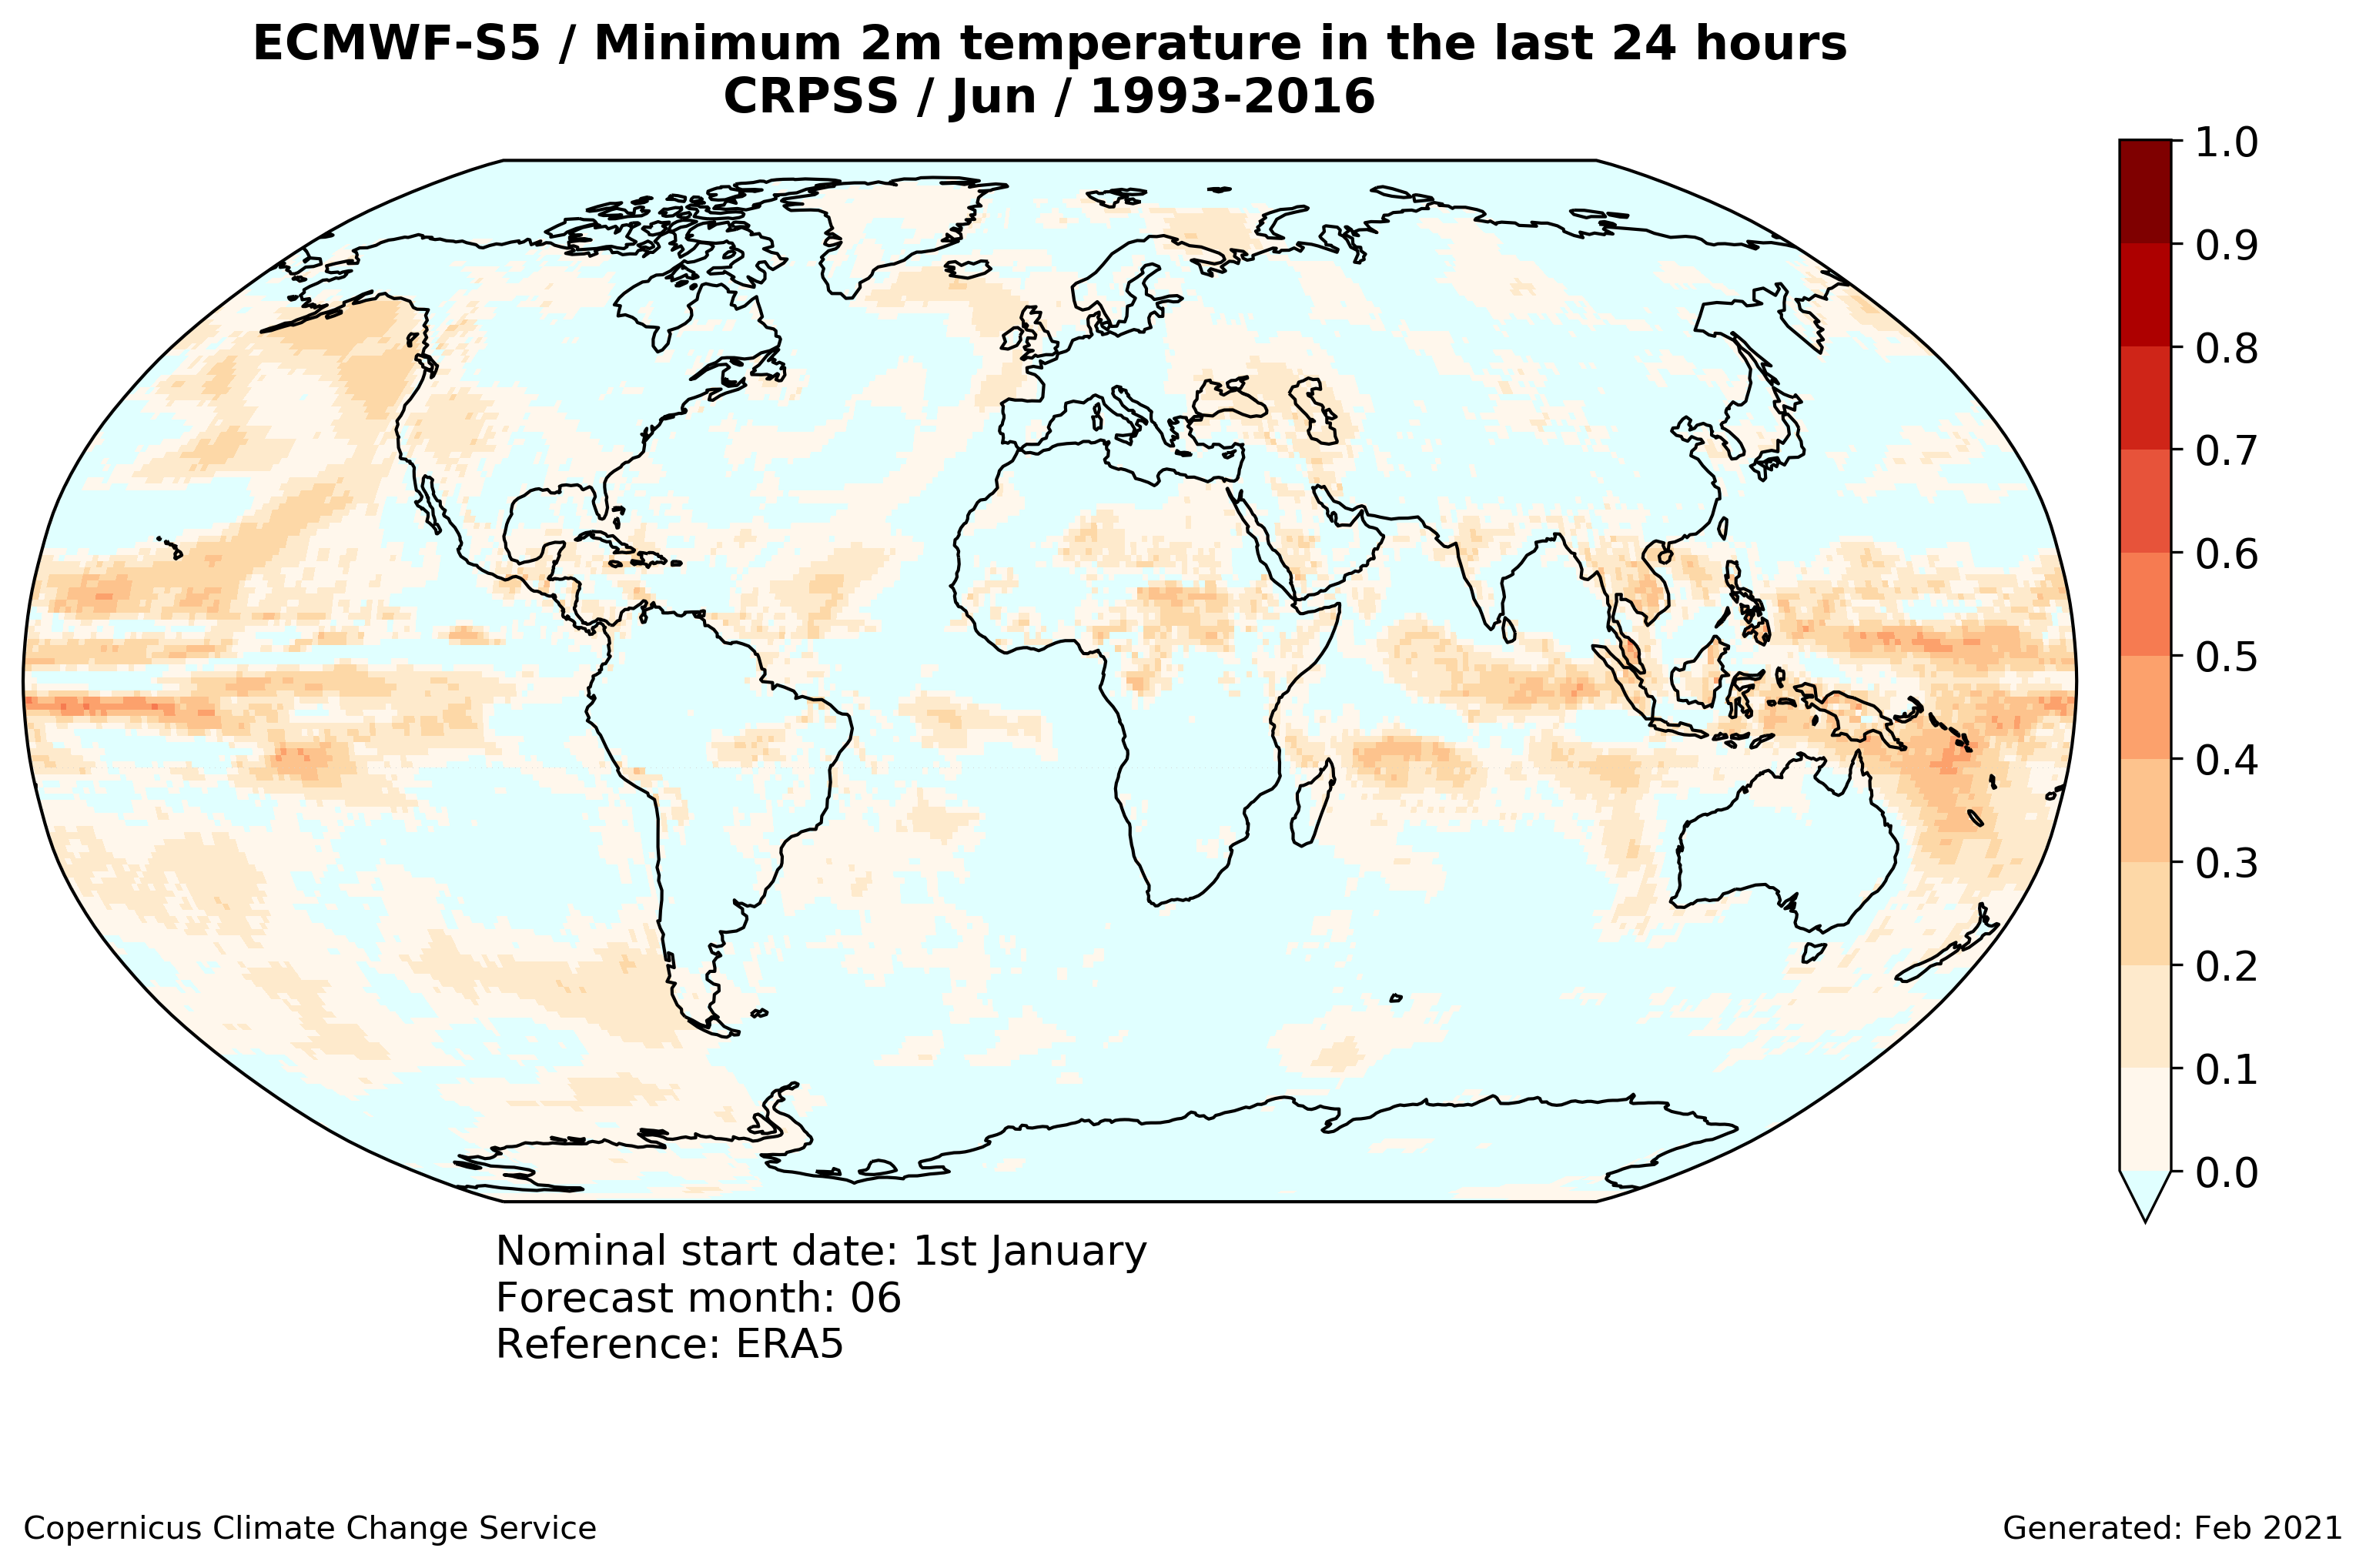
For the essential climate variables, the title and caption follow the structure:
I'll include @nmilders in this issue so that she can provide feedback as well.
Thanks,
Núria