Hi @vagudets
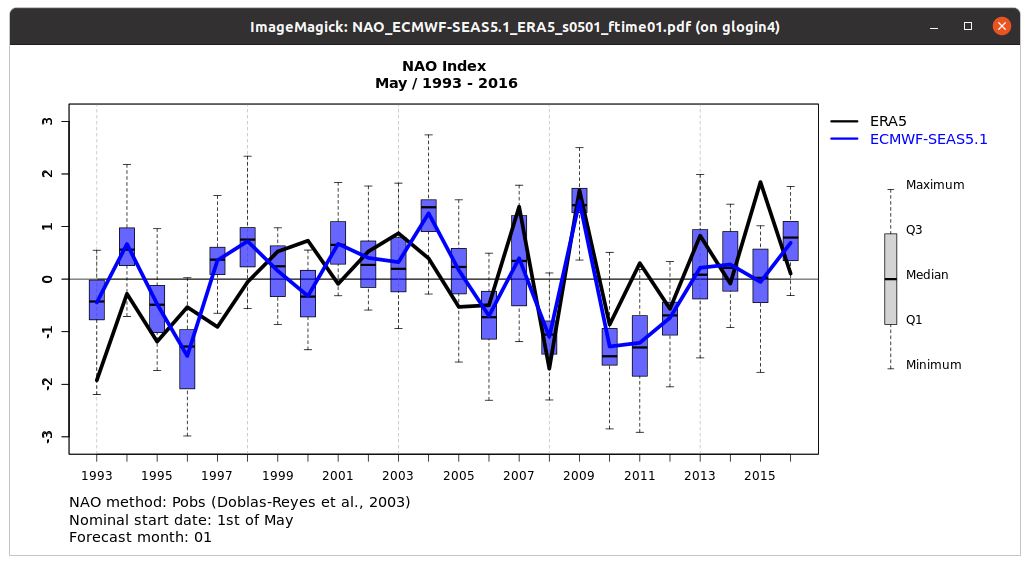
I have followed the Crossval_anomalies.R to try to adapt the NAO version for the master. I have managed to calculate the skill and also create some plots:
Given that the NAO is now in two modules (Indices and Crossval), the visualisation functions could be moved to Visualization module.
The approach of using the output_dims parameter from multiApply was useful for Crossval_anomalies because the data_cubes suffered only a few changes in the dimensions. In this case, I think it is better to ensure that we have the expected dimensions at the end of the cross-validation loop.
Núria