PlotMostLikelyQuantileMaps doesn't allow triangle ends?
Hi @erifarov
I have been trying to set triangle_ends for PlotMostLilelyQuantileMap function and I ended up modifying the auxiliary function GradientCatsColorBar()
The objective is to avoid displaying 100% in any legend that is displaying probabilities.
What I have done is that, once the brks and colors are known, use the last color as col_sup and consequently removing the last brk from the list.
The result is 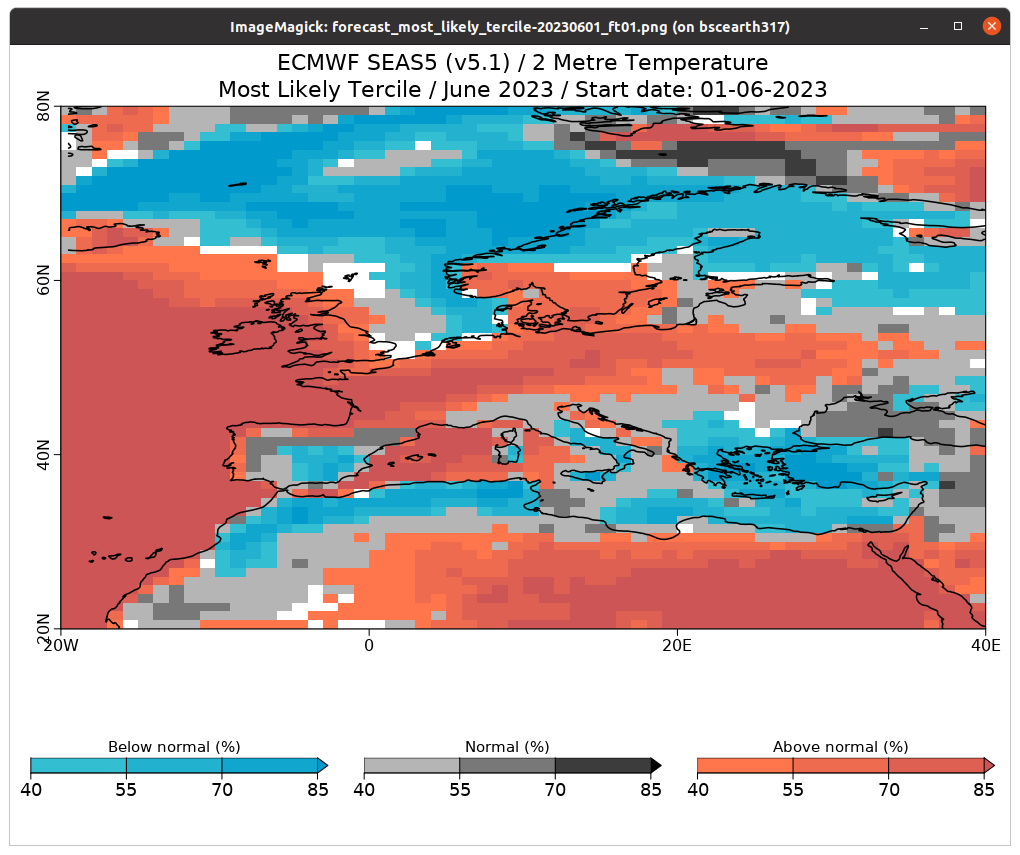
The changes are at the end of the function just before calling s2dv::ColorBar
  if (plot) {
brks <- brks[-length(brks)] # NEW
    for (k in 1:nmap) {
triangle_ends <- c(F,T) # NEW
col_sup <- cols[[k]][length(cols[[k]])] # NEW
cols[[k]] <- cols[[k]][-length(cols[[k]])] # NEW
I am using this change as a temporal solution here https://earth.bsc.es/gitlab/es/auto-s2s/-/blob/dev-csoper/modules/Visualization/R/tmp/GradientCatsColorBar.R
So, right now this is not urgent but I wanted to share this potential development with you.
Cheers,
Núria
FYI @vtorralb2 (@vtorralba ?)