Skip to content
GitLab
Projects Groups Topics Snippets
  • /
  • Help
    • Help
    • Support
    • Community forum
    • Submit feedback
  • Sign in
  • CSTools CSTools
  • Project information
    • Project information
    • Activity
    • Labels
    • Members
  • Repository
    • Repository
    • Files
    • Commits
    • Branches
    • Tags
    • Contributor statistics
    • Graph
    • Compare revisions
  • Issues 28
    • Issues 28
    • List
    • Boards
    • Service Desk
    • Milestones
  • Merge requests 2
    • Merge requests 2
  • CI/CD
    • CI/CD
    • Pipelines
    • Jobs
    • Schedules
  • Deployments
    • Deployments
    • Environments
    • Releases
  • Monitor
    • Monitor
    • Metrics
    • Incidents
  • Analytics
    • Analytics
    • Value stream
    • CI/CD
    • Repository
  • Wiki
    • Wiki
  • Snippets
    • Snippets
  • Activity
  • Graph
  • Create a new issue
  • Jobs
  • Commits
  • Issue Boards
Collapse sidebar
  • External
  • CSToolsCSTools
  • Issues
  • #46
Closed
Open
Issue created May 08, 2020 by Louis-Philippe Caron@lcaronMaintainer

problem going across Greenwich with PlotMostLikelyQuantiles

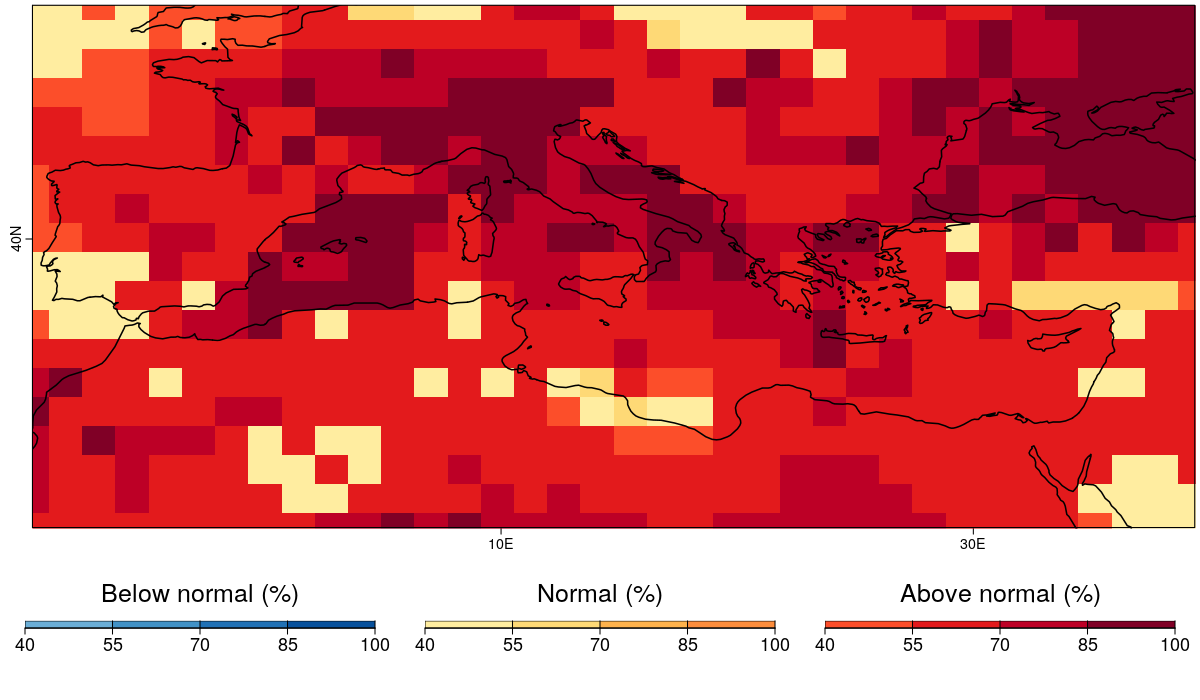
I discovered a bug with this function. If we plot the likely terciles over Europe, it's usually good:

tas_most_likely_tercile

But if I plot happen to go from a negative longitude to a positive longitude using a mask, suddenly, a line appears:

tas_most_likely_tercile_mask

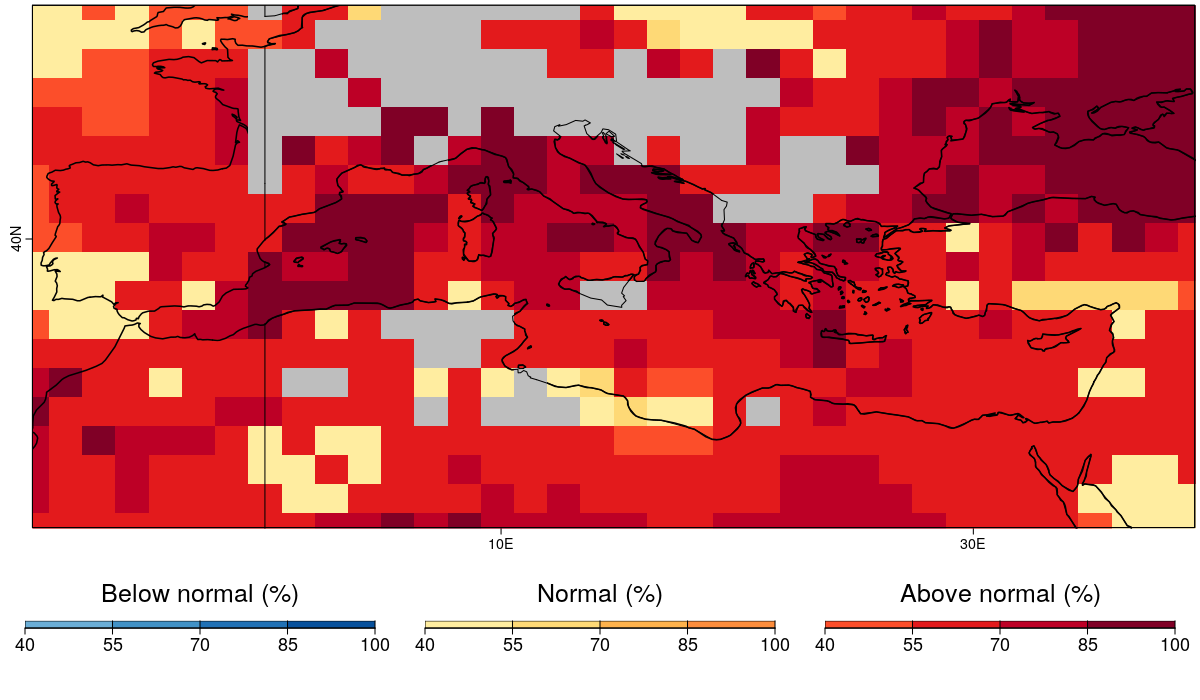
But also, the mask doesn't seem to work on the western side of longitude 0. I used the RPSS to create a mask:

tas_RPSS

and the data with longitude >0 are masked correctly, but the data with longitude <0 are not masked at all.

Thoughts @nperez ?

Assignee
Assign to
Time tracking