Skip to content
GitLab
Projects Groups Topics Snippets
  • /
  • Help
    • Help
    • Support
    • Community forum
    • Submit feedback
  • Sign in
  • CSTools CSTools
  • Project information
    • Project information
    • Activity
    • Labels
    • Members
  • Repository
    • Repository
    • Files
    • Commits
    • Branches
    • Tags
    • Contributor statistics
    • Graph
    • Compare revisions
  • Issues 28
    • Issues 28
    • List
    • Boards
    • Service Desk
    • Milestones
  • Merge requests 2
    • Merge requests 2
  • CI/CD
    • CI/CD
    • Pipelines
    • Jobs
    • Schedules
  • Deployments
    • Deployments
    • Environments
    • Releases
  • Monitor
    • Monitor
    • Metrics
    • Incidents
  • Analytics
    • Analytics
    • Value stream
    • CI/CD
    • Repository
  • Wiki
    • Wiki
  • Snippets
    • Snippets
  • Activity
  • Graph
  • Create a new issue
  • Jobs
  • Commits
  • Issue Boards
Collapse sidebar
  • External
  • CSToolsCSTools
  • Issues
  • #72
Closed
Open
Issue created Nov 06, 2020 by Pep Cos@jcosDeveloper

y and x labels cut out of the plot window with PlotTriangles4Categories function

Hi @nperez

If x and y labels text is too long when using PlotTriangles4Categories they get cut out of the plot window. Playing around with the 'res' and 'figures.width' parameters doesn't solve the issue. I've tried modifying the function and adding a variable value to the axes cex.axis attribute and it seems to be doing the job as it reduces the labels font sizes. Instead of:

if (xlab){
    axis(1, at =(1:ncol) - 0.5, las = 2, labels = xlabels, cex.axis = 1.5)
  }
  if (ylab){
    axis(2, at = (1:nrow) - 0.5, las = 2, labels = ylabels, cex.axis = 1.5)
  }

I'm using:

if (xlab){
    axis(1, at =(1:ncol) - 0.5, las = 2, labels = xlabels, cex.axis = cex_axis)
  }
  if (ylab){
    axis(2, at = (1:nrow) - 0.5, las = 2, labels = ylabels, cex.axis = cex_axis)
  }

and I add cex_axis to the function's parameters list. In my case a value of cex_axis=0.5 solves the bounds getting cut. Nevertheless, the result is quite ugly as the tiles seem too big compared to the tiny label text. Do you think there is a better way to deal with this issue?

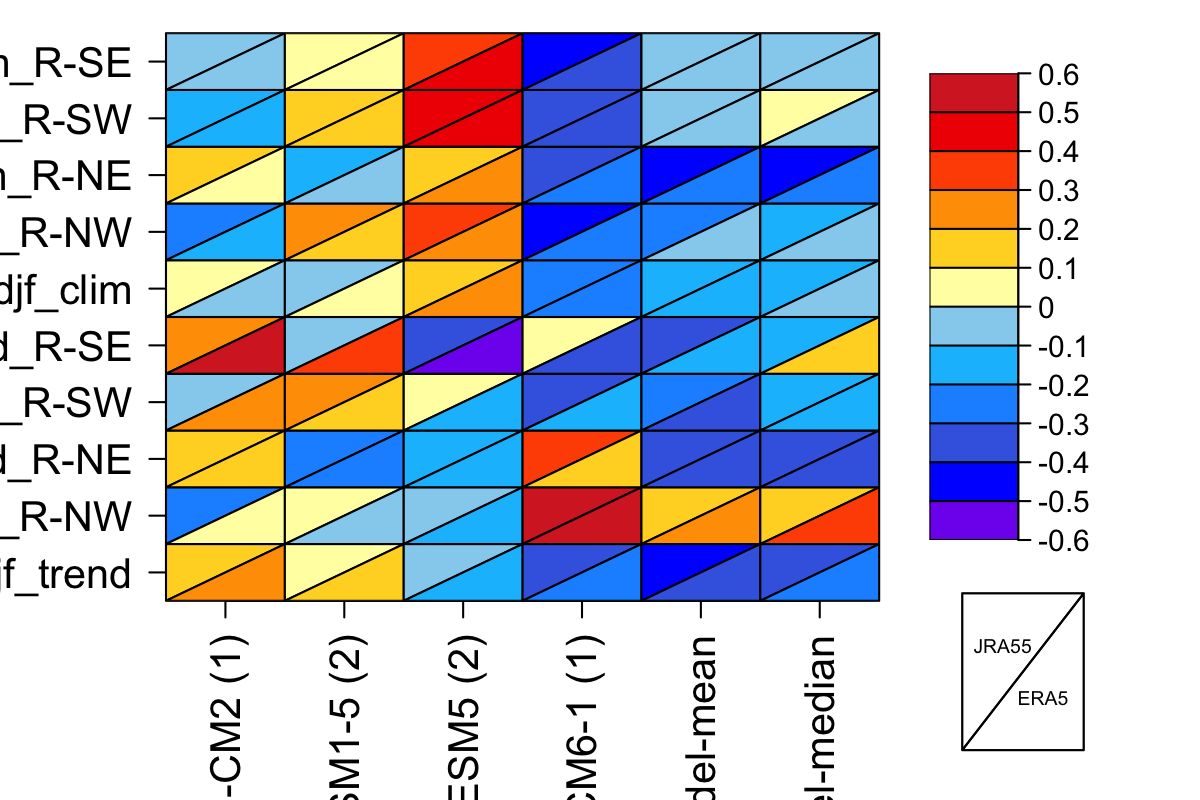
The before and after adding cex_axis:

Assignee
Assign to
Time tracking