Contribution analytics (PREMIUM)
Introduced in GitLab 12.2 for subgroups.
Contribution analytics provide an overview of the contribution events made by your group's members.
Use contribution analytics data visualizations to:
- Analyze your group's contributions over a period of time.
- Identify group members who are high-performers or may benefit from additional support.
View contribution analytics
To view contribution analytics:
- On the top bar, select Main menu > Groups and find your group.
- On the left sidebar, select Analytics > Contribution.
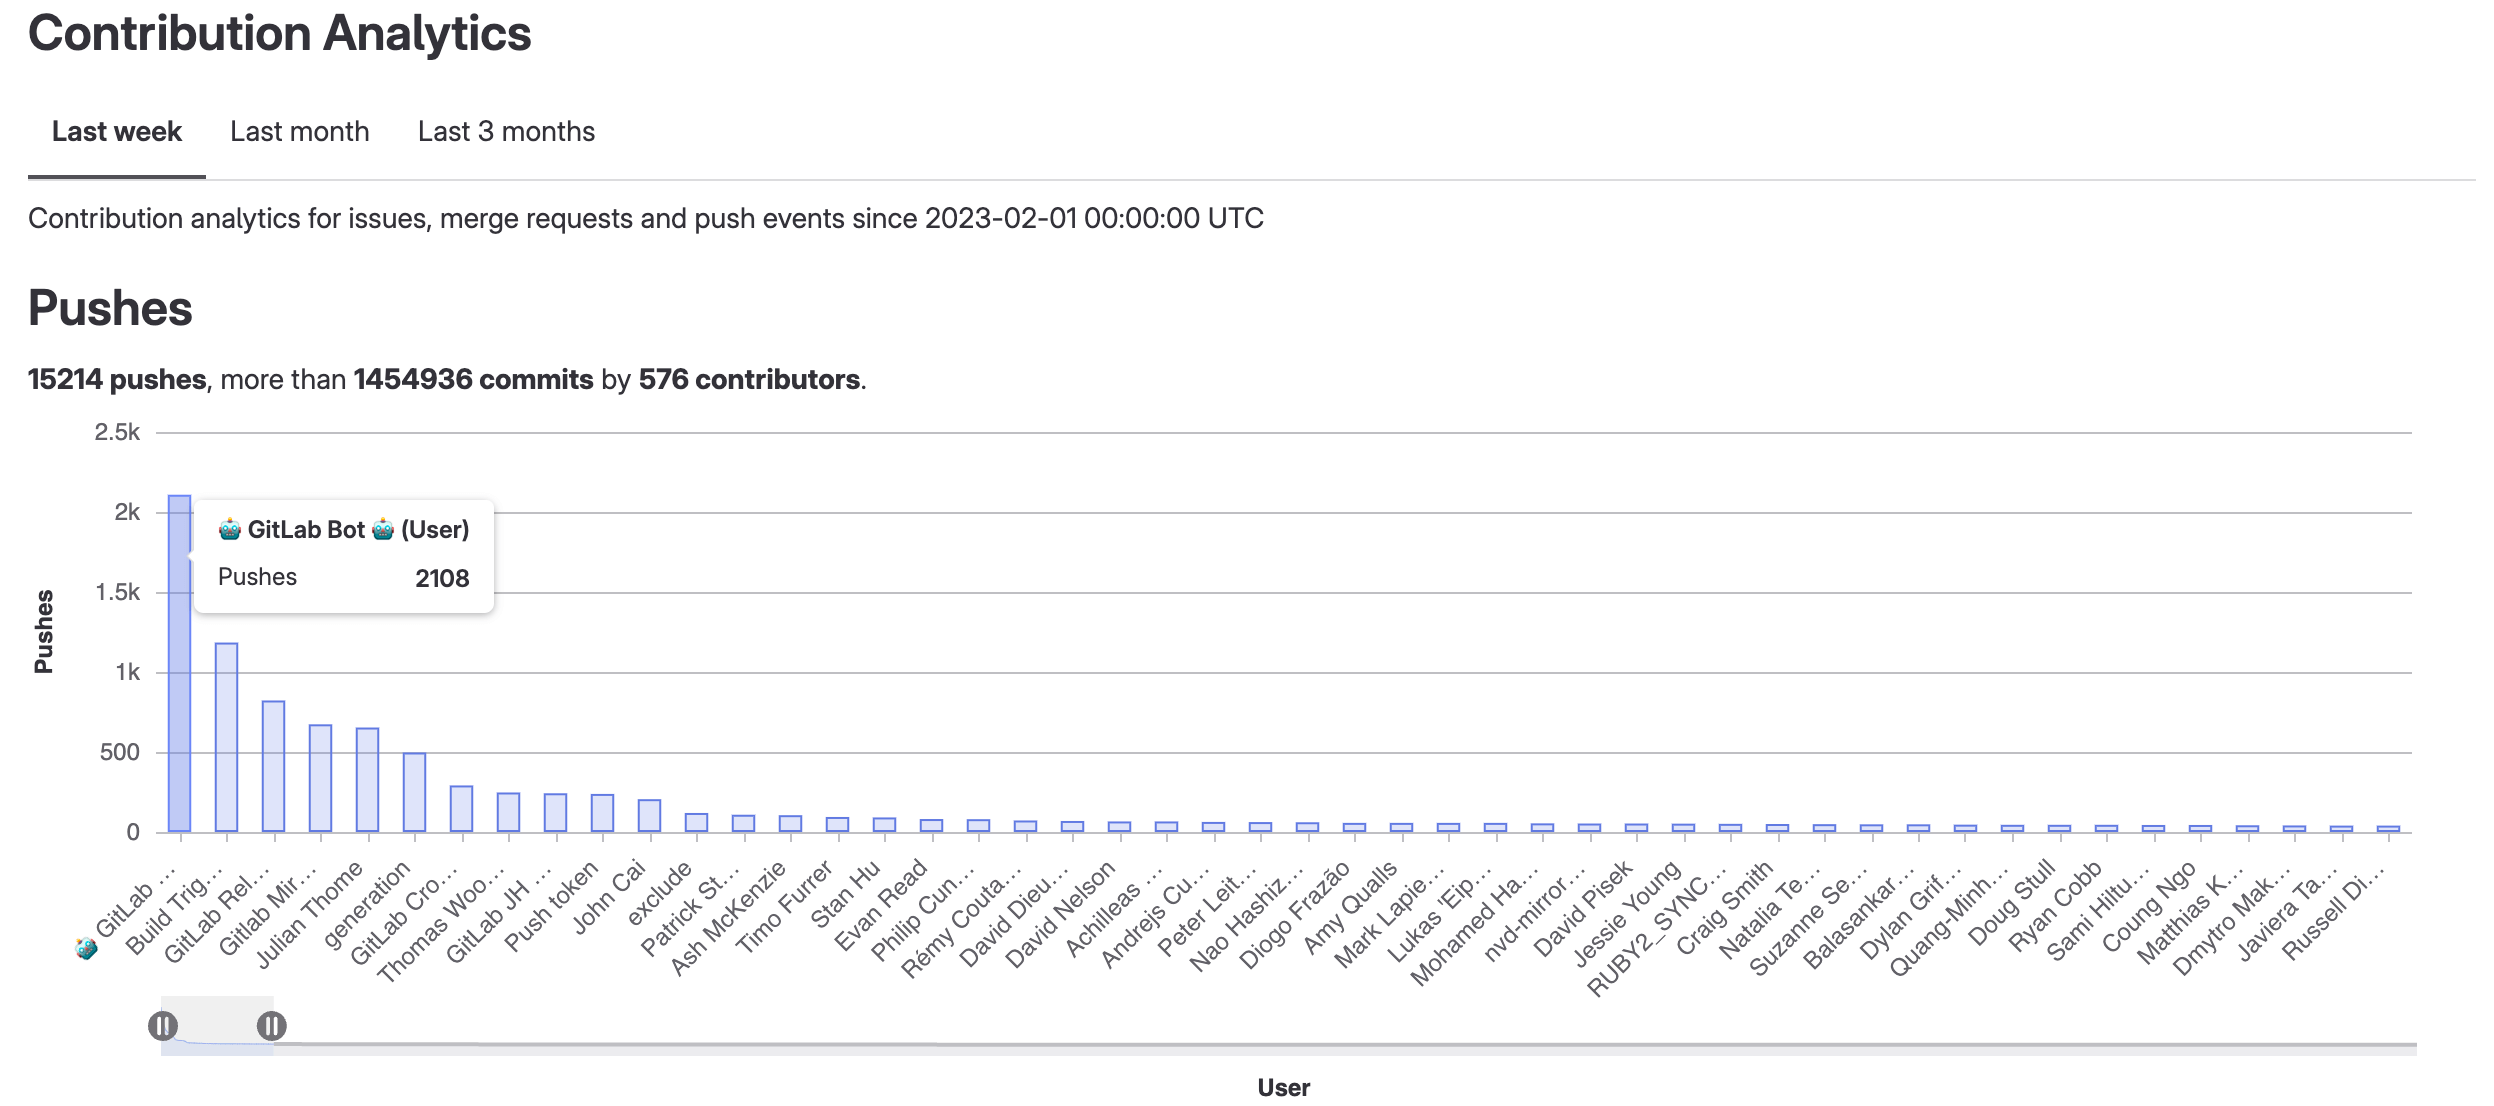
Three bar charts and a table illustrate the number of contributions made by each group member:
- Push events
- Merge requests
- Closed issues
View a member's contributions
You can view the number of events associated with a specific group member.
To do this, hover over the bar with the member's name.
Zoom in on a chart
You can zoom in on a bar chart to display only a subset of group members.
To do this, select the sliders ({status-paused}) below the chart and slide them along the axis.
Sort contributions
Contributions per group member are also displayed in tabular format. The table columns include the members' names and the number of contributions for different events.
To sort the table by a column, select the column header or the chevron ({chevron-lg-down} for descending order, {chevron-lg-up} for ascending order).
Change the time period
You can display contribution analytics over different time periods:
- Last week (default)
- Last month
- Last three months
To change the time period of the contribution analytics, select one of the three tabs under Contribution Analytics.
The selected time period applies to all charts and the table.
Contribution analytics GraphQL API
To retrieve metrics for user contributions, use the GraphQL API.