Autosubmit Job List Structure persistence
I am creating this issue to help track the progress of this new feature and post any doubts that appear about which way its development should go. In addition, it will serve as a source of information for future documentation.
Problem:
As we know, the transitive reduction of the graph generated from the experiment has the highest time and computation cost of all the processes involved in JobList creation and management. Furthermore, JobList related processes are constantly executed in the lifecycle of an experiment.
Objective:
The main objective of this feature is to offer the user the possibility to save the result of the transitive reduction so Autosubmit can access it and avoid performing transitive reduction every time it needs to read the JobList. The bigger, in the number of jobs, the experiment is, the greater the time and computation cost saved.
Secondary Objective:
Develop and present a historic complexity analysis of experiments managed by Autosubmit.
Analysis:
It seems interesting and useful to take a look at the experiments Autosubmit has been managing so far. Here is some analysis based on the data Autosubmit API has been collecting in the past weeks:
Overview
There are a total of 2778 unique registered experiments. After we filter out those experiments with 0 jobs or those in which less than 10% of jobs have been completed, we end up with 2038 valid experiments.
In the following plot, we see the distribution of experiments by their number of jobs.
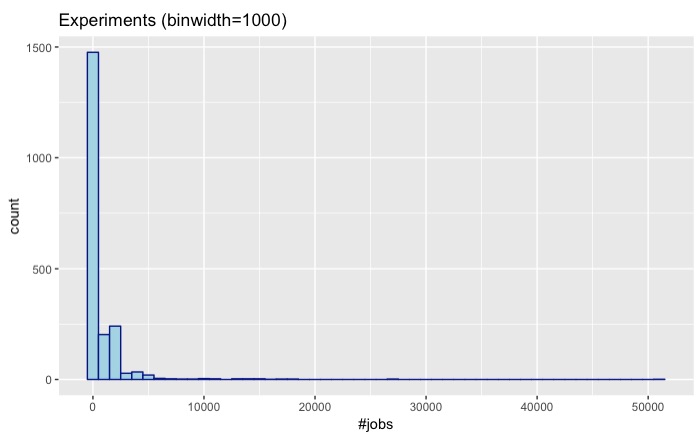
Where \mu = 759 and \overline{x} = 56.
The time cost of the transitive reduction process, which is executed regularly while using the features of Autosubmit, has polynomial growth as a function of the number of jobs n_i of the experiment i. We select 3000 as an arbitrary lower bound and then divide the dataset of experiments into 2 groups: n_i >= 3000, and n_i < 3000.
Then, we have that:
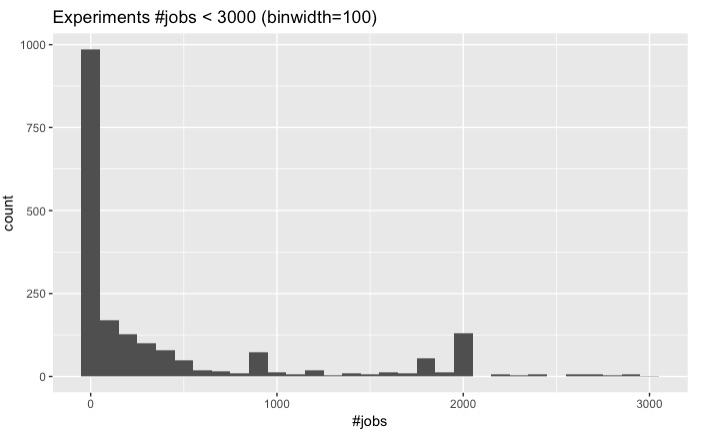
- 97 experiments have 3000 jobs or more.
- 1941 experiments have less than 3000 jobs.
Here are their distributions:
n_i < 3000 |
n_i >= 3000 |
|---|---|
 |
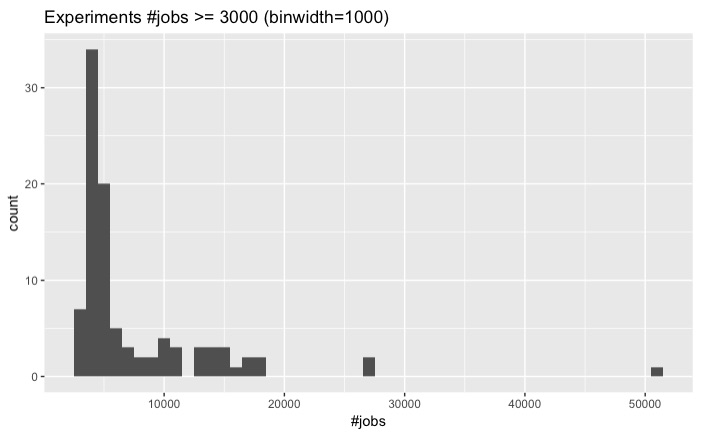 |
Seems that the vast majority of our experiments are under 10000 jobs. Theoretically, Autosubmit GUI should be able to handle experiments around 20000 jobs in less than 10 minutes; however, we do not really want to make our users wait ten minutes to see the graph or tree representation of his experiment.
Data comparison
Now let's take a look at how the distribution has been changing (or not) over time.
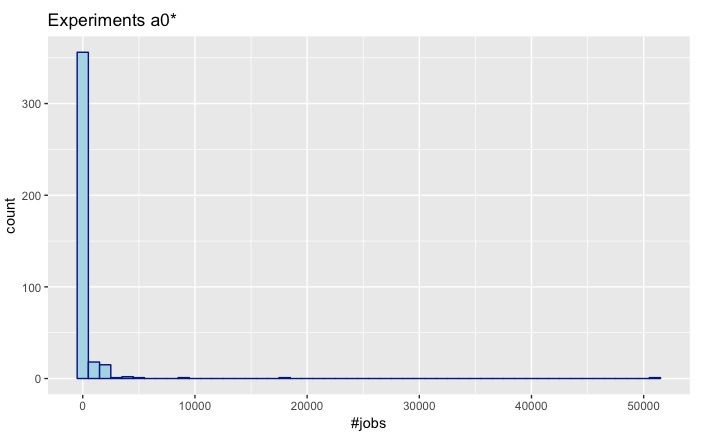
It was decided (as a simplification) to make this small analysis using the prefix of the experiment name, so we start by dividing our dataset into three groups according to the first 2 characters of the experiment name. We have that:
- 396 experiments starting with a0.
- 747 experiments starting with a1.
- 705 experiments starting with a2.
Now consider that:
- Experiments starting with a0 date approximately from April 2015 until April 2018.
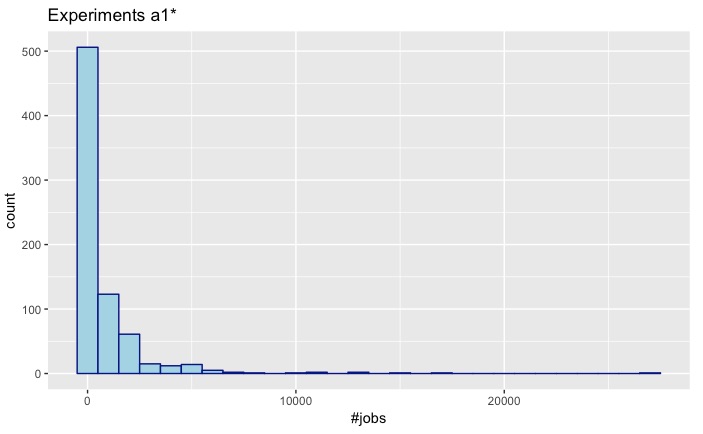
- Experiments starting with a1 date approximately from April 2018 until July 2019. Around 16 months.
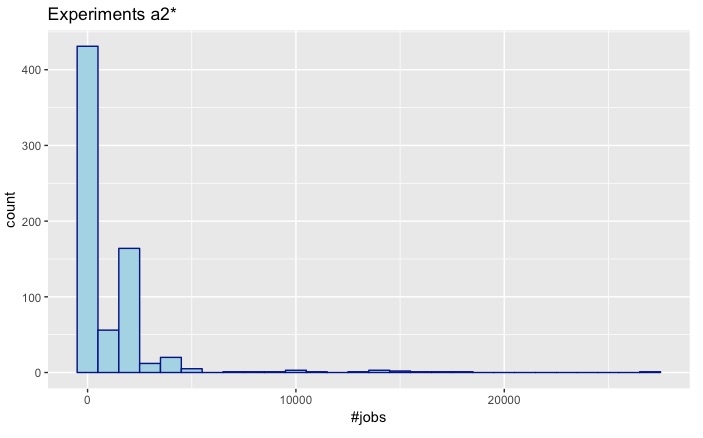
- Experiments starting with a2 date approximately from July 2019 until April 2020. Around 9 months.
| a1 | a2 |
|---|---|
 |
 |
- There are 396 experiments starting with a0.
- There are 747 experiments starting with a1.
- There are 705 experiments starting with a2.
The distributions of a1 and a2 seem more closely related. So let's take a quick look at their distributions:
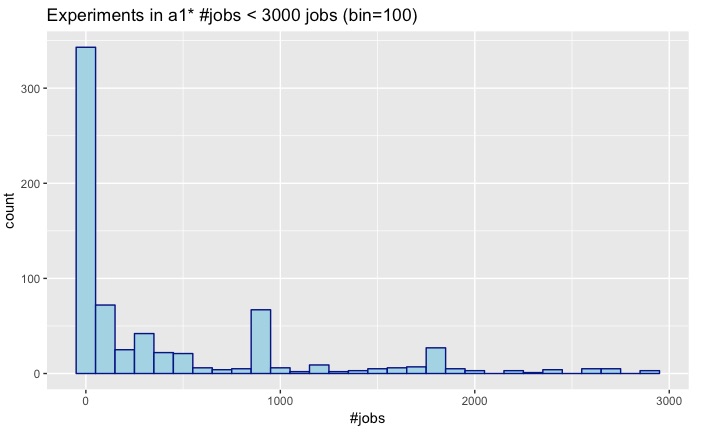
a1 n_i < 3000
|
a1 n_i >= 3000
|
|---|---|
 |
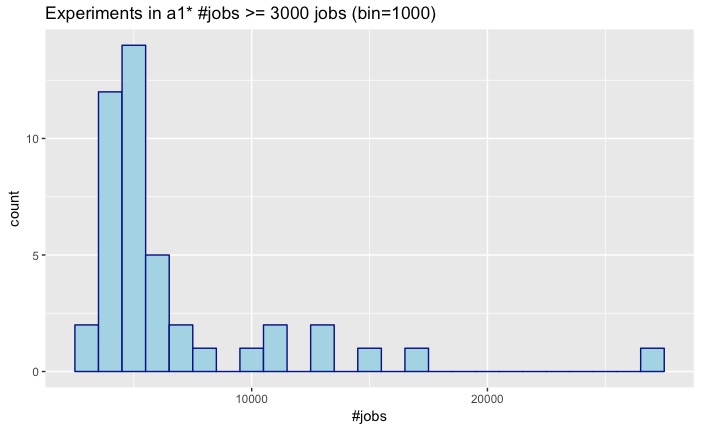 |
- 44 experiments have 3000 jobs or more.
- 703 experiments have less than 3000 jobs.
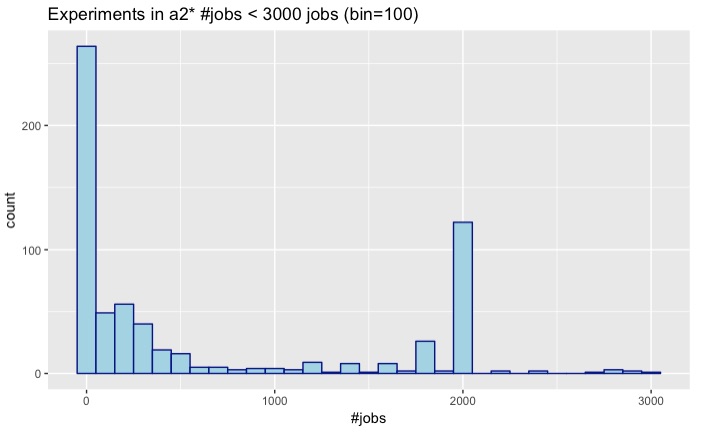
a2 n_i < 3000
|
a2 n_i >= 3000
|
|---|---|
 |
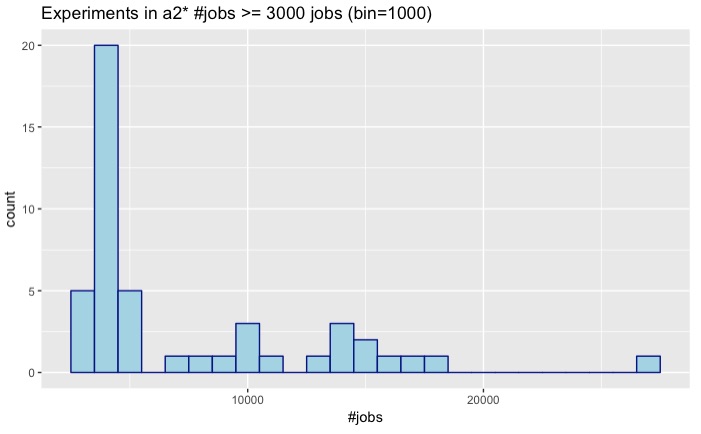 |
- 47 experiments have 3000 jobs or more.
- 658 experiments have less than 3000 jobs.
Conclusion
The prefix a2 has been in usage for 7 months less than a1 but it has almost the same number of experiments. Also, given the similarity of their distributions, it is not out of the realm of possibilities that the prefix a2 will end with more experiments in n_i >= 3000 than a1. Of course, some prediction algorithm could give us an approximate number of large experiments that we should expect by the end of a2. However, this simple analysis has been performed only using the nomenclature difference of experiments. A more in-depth analysis should define appropriate time spans and filters to have a good starting point.
In conclusion, this small analysis serves as a way to justify the need for optimization in Autosubmit to handle large experiments (as measured by the number of jobs), and also to showcase some of the data that can be queried an analyzed now thanks to Autosubmit API.
Dataset (31-03-2020): experiment_jobs.txt
Development:
Let's start with an important question:
Should the database where the JobList is stored be individual for each experiment (like packages), or should it be centralized in a single database for all experiments (like ec_earth.db)?