Hi @eexarchou, @aho,
I have fixed the bug in AbsBiasSS() mentioned in the issue #80 (closed).
The significance is now computed before the time averaging. I have used the code you provided in the issue to make sure that the bug is fixed. I had to change lonmax <- 180 to lonmax <- 179 because only one longitude was loaded otherwise. Also, I have assumed that a511.mjj, a511.aso, a511.ndj and a511.fma are seasonal means and that the experiments are initialised in May (please check the lines just before computing the skill score, where s2dv::Season is used):
# Delete previous data
rm(list=ls())
gc()

library(boot)
library(s2dv)
library(abind)
library(s2dverification)
library(startR)
library(ncdf4)
library(multiApply)
library(SpecsVerification)

#source('AbsBiasSS.R')
#source('Bias.R')
#source('RandomWalkTest.R')

# ATL
lonmin <- -180
lonmax <-  179
latmin <- -60
latmax <-  50

sdates <-  paste0(c(1981:2002), '0501')

# exp
repos_a511 <-  paste0('/esarchive/scratch/eexarcho/Eleftheria/Pace_maker/Data/a511/tos/r360x180/',
                      '$var$_Omon_EC-Earth3-CC_troppac-pacemaker_s$sdate$-$member$_r360x180_$chunk$.nc')

repos_a53d <-  paste0('/esarchive/scratch/eexarcho/Eleftheria/Pace_maker/Data/a53d/tos/r360x180/',
                      '$var$_Omon_EC-Earth3-CC_troppac-pacemaker_s$sdate$-$member$_r360x180_$chunk$.nc')

a511 <- Start(dat = repos_a511,
              var = 'tos',
              member = 'all',
              sdate = sdates,
              chunk = 'all',
              #   time = 'all',
              time = indices(1:12),  #first time step per day
              chunk_depends = 'sdate',
              time_across = 'chunk',
              merge_across_dims = TRUE,
              lat = values(list(latmin, latmax)),
              lat_reorder = Sort(), ##1
              lon = values(list(lonmin, lonmax)),
              lon_reorder = CircularSort(-180, 180), ##2
              synonims = list(lat = c('lat', 'latitude'),
                              lon = c('lon', 'longitude')),
              return_vars = list(lon = 'dat',  ##3
                                 lat = 'dat',  ##3
                                 time = 'sdate'),
              retrieve = T)


a53d <- Start(dat = repos_a53d,
              var = 'tos',
              member = 'all',
              sdate = sdates,
              chunk = 'all',
              #   time = 'all',
              time = indices(1:12),  #first time step per day
              chunk_depends = 'sdate',
              time_across = 'chunk',
              merge_across_dims = TRUE,
              lat = values(list(latmin, latmax)),
              lat_reorder = Sort(), ##1
              lon = values(list(lonmin, lonmax)),
              lon_reorder = CircularSort(-180, 180), ##2
              synonims = list(lat = c('lat', 'latitude'),
                              lon = c('lon', 'longitude')),
              return_vars = list(lon = 'dat',  ##3
                                 lat = 'dat',  ##3
                                 time = 'sdate'),
              retrieve = T)

###lons <- attr(exp, 'Variables')$common$tos$dim[[1]]$vals
###lats <- attr(exp, 'Variables')$common$tos$dim[[2]]$vals
lons <- as.vector(attr(a511, 'Variables')$dat1$lon)
lats <- as.vector(attr(a511, 'Variables')$dat1$lat)
dates <- attr(a511, 'Variables')$common$time
dates_file <- sort(unique(gsub('-', '', sapply(as.character(dates), substr, 1, 7))))
##
## obs
repos_obs <- '/esarchive/obs/ukmo/hadisst_v1.1/monthly_mean/$var$/$var$_$date$.nc'

obs.data <- Start(dat = repos_obs,
                  var = 'tos',
                  date = dates_file,
                  # time = 'all',
                  # time_across = 'date',
                  # merge_across_dims = TRUE,
                  # merge_across_dims_narm = TRUE,
                  ## -----------------------------------------------------------------------
                  time = values(dates),  #dim: [sdate = 2, time = 12]
                  #because time is assigned by 'values', set the tolerance to avoid too distinct match
                  time_var = 'time',
                  #             time_tolerance = as.difftime(372, units = 'hours'),
                  #time values are across all the files
                  time_across = 'date',
                  #combine time and file_date dims
                  merge_across_dims = TRUE,
                  #exclude the additional NAs generated by merge_across_dims
                  merge_across_dims_narm = TRUE,
                  #split time dim, because it is two-dimensional
                  split_multiselected_dims = TRUE,
                  ## -----------------------------------------------------------------------
                  lat = values(lats),
                  lon = values(lons),
                  #---------transform to get identical lat and lon------------ ##4
                  transform = CDORemapper,
                  transform_extra_cells = 2,
                  transform_params = list(grid = 'r360x180',
                                          method = 'conservative',
                                          crop = c(lonmin, lonmax, latmin, latmax)),
                  transform_vars = c('lat', 'lon'),
                  #-----------------------------------------------------------
                  synonims = list(lat = c('lat', 'latitude'),
                                  lon = c('lon', 'longitude')),
                  return_vars = list(lat = NULL,  ##3
                                     lon = NULL,  ##3
                                     time = 'date'),
                  retrieve = TRUE)

##### I have added this

a511.mjj <- s2dv::Season(data = a511, time_dim = 'time', monini = 5, moninf = 5, monsup = 7, method = mean, na.rm = F, ncores = 4)
a511.aso <- s2dv::Season(data = a511, time_dim = 'time', monini = 5, moninf = 8, monsup = 10, method = mean, na.rm = F, ncores = 4)
a511.ndj <- s2dv::Season(data = a511, time_dim = 'time', monini = 5, moninf = 11, monsup = 1, method = mean, na.rm = F, ncores = 4)
a511.fma <- s2dv::Season(data = a511, time_dim = 'time', monini = 5, moninf = 2, monsup = 4, method = mean, na.rm = F, ncores = 4)

a53d.mjj <- s2dv::Season(data = a53d, time_dim = 'time', monini = 5, moninf = 5, monsup = 7, method = mean, na.rm = F, ncores = 4)
a53d.aso <- s2dv::Season(data = a53d, time_dim = 'time', monini = 5, moninf = 8, monsup = 10, method = mean, na.rm = F, ncores = 4)
a53d.ndj <- s2dv::Season(data = a53d, time_dim = 'time', monini = 5, moninf = 11, monsup = 1, method = mean, na.rm = F, ncores = 4)
a53d.fma <- s2dv::Season(data = a53d, time_dim = 'time', monini = 5, moninf = 2, monsup = 4, method = mean, na.rm = F, ncores = 4)

obs.mjj <- s2dv::Season(data = obs.data, time_dim = 'time', monini = 5, moninf = 5, monsup = 7, method = mean, na.rm = F, ncores = 4)
obs.aso <- s2dv::Season(data = obs.data, time_dim = 'time', monini = 5, moninf = 8, monsup = 10, method = mean, na.rm = F, ncores = 4)
obs.ndj <- s2dv::Season(data = obs.data, time_dim = 'time', monini = 5, moninf = 11, monsup = 1, method = mean, na.rm = F, ncores = 4)
obs.fma <- s2dv::Season(data = obs.data, time_dim = 'time', monini = 5, moninf = 2, monsup = 4, method = mean, na.rm = F, ncores = 4)

source('https://earth.bsc.es/gitlab/es/s2dv/-/raw/develop-AbsBiasSS-sign/R/AbsBiasSS.R')
.Bias <- s2dv:::.Bias
.RandomWalkTest <- s2dv:::.RandomWalkTest

##### Until here

abs.bias.a511.mjj <- AbsBiasSS(a511.mjj, obs.mjj-273.15, a53d.mjj,
                                     memb_dim = 'member', dat_dim='dat', ncores=16)
abs.bias.a511.aso <- AbsBiasSS(a511.aso, obs.aso-273.15, a53d.aso,
                                     memb_dim = 'member', dat_dim='dat', ncores=16)
abs.bias.a511.ndj <- AbsBiasSS(a511.ndj, obs.ndj-273.15, a53d.ndj,
                                     memb_dim = 'member', dat_dim='dat', ncores=16)
abs.bias.a511.fma <- AbsBiasSS(a511.fma, obs.fma-273.15, a53d.fma,
                                     memb_dim = 'member', dat_dim='dat', ncores=16)

min2=-2.
max2=2.
int2=(max2-min2)/20
interval2=seq(min2,max2,int2)
clim.palette(palette = "bluered")
color=clim.colors(20, palette = "bluered")
pdf( "~/Desktop/SST_bias_SS_a511_a53d.pdf" )
nf    <- layout(matrix(c(1, 2 , 3, 4, 5, 5, 5, 5),2,4,byrow=TRUE),
                widths=1, heights=c(1,0.3), TRUE)

s2dv::PlotEquiMap( abs.bias.a511.mjj$biasSS[1, 1, 1, 1, , ],
                   lons, lats ,
                   toptitle= "SST bias SS, MJJ",
                   cols=color, brks=interval2, drawleg = F,
                   triangle_ends = c(T,T), col_inf = color[1], col_sup = color[20],
                   filled.continents = T,
                   dots = abs.bias.a511.mjj$sign[1, 1, 1, 1, ,],
                   dot_size = 0.5,
                   numbfig=4
)


s2dv::PlotEquiMap( abs.bias.a511.aso$biasSS[1, 1, 1, 1, , ],
                   lons, lats ,
                   toptitle= "SST bias SS, ASO",
                   cols=color, brks=interval2, drawleg = F,
                   triangle_ends = c(T,T), col_inf = color[1], col_sup = color[20],
                   filled.continents = T,
                   dots = abs.bias.a511.aso$sign[1, 1, 1, 1, ,],
                   dot_size = 0.5,
                   numbfig=4
)

s2dv::PlotEquiMap( abs.bias.a511.ndj$biasSS[1, 1, 1, 1, , ],
                   lons, lats ,
                   toptitle= "SST bias SS, NDJ",
                   cols=color, brks=interval2, drawleg = F,
                   triangle_ends = c(T,T), col_inf = color[1], col_sup = color[20],
                   filled.continents = T,
                   dots = abs.bias.a511.ndj$sign[1, 1, 1, 1, ,],
                   dot_size = 0.5,
                   numbfig=4
)

s2dv::PlotEquiMap( abs.bias.a511.fma$biasSS[1, 1, 1, 1, , ],
                   lons, lats ,
                   toptitle= "SST bias SS, FMA",
                   cols=color, brks=interval2, drawleg = F,
                   triangle_ends = c(T,T), col_inf = color[1], col_sup = color[20],
                   filled.continents = T,
                   dots = abs.bias.a511.fma$sign[1, 1, 1, 1, ,],
                   dot_size = 0.5,
                   numbfig=4
)

ColorBar(brks=interval2,
         triangle_ends = c(T,T), col_inf = color[1], col_sup = color[20],
         cols = color, vert = FALSE)
dev.off()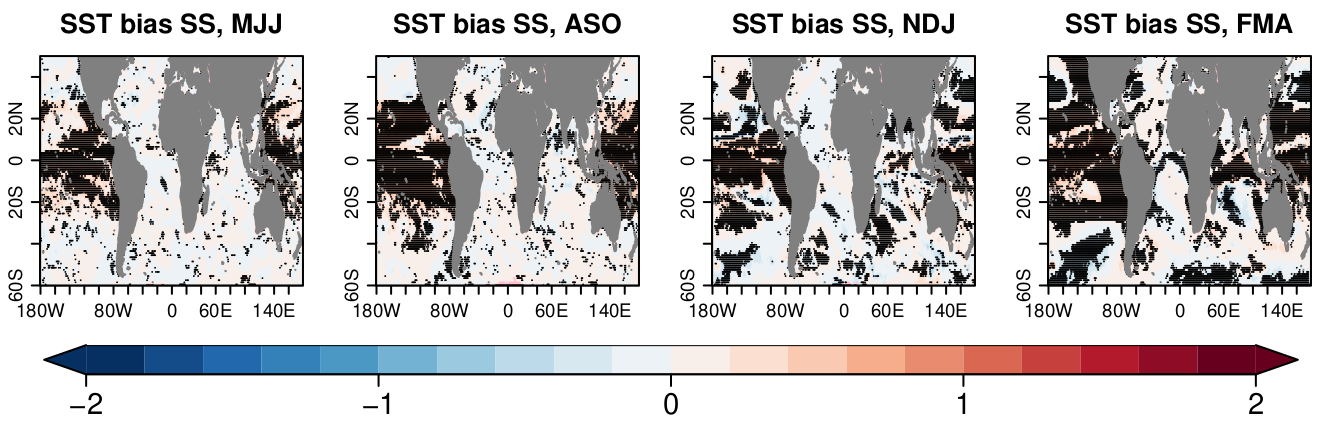
Please let me know if you think the new version is correct or if any modifications are needed.
A suggestion: for plotting skill scores, I think a more suitable colorbar would be one from -0.9 to 0.9 with triangle_ends = c(T,T), or from -1 to 1 with triangle_ends = c(T,F). This is because the skill scores range from -Inf to 1. But, of course, everyone can decide different bar limits :)
Best regards,
Carlos